Table of Contents
Sizing a local market with public business data means estimating how much room is actually left inside one specific trade area. It is not the same as copying a national TAM number into a city or treating Google review counts as revenue.
This method is for local SEO agencies scoping a client’s territory, franchise teams comparing candidate locations, business owners reviewing a second location, and sales teams deciding whether a city or category is worth targeting.
It is not built for investor TAM slides.
Investors usually expect industry-report-sourced TAM, formal assumptions, and broader market data. This method is for a more practical question:
Is this specific local market worth entering, selling into, or expanding across?
Most local market sizing fails for two reasons.
First, teams scale a national number down by population and ignore local supply.
Second, they treat Google review counts as demand, even though review behavior changes heavily by category.
A better approach is to define the real trade area, pull the local competitor set, use reviews for relative strength, add population and category demand inputs, and calculate a realistic range instead of a guess.
Who This Method Is Actually For
This method is for practical local decisions where the question is not “How big is the national market?” but “How much opportunity exists in this specific area?” It works best for agencies, franchise teams, small business owners, and sales teams comparing real territories.
The problem is that teams often use the wrong market sizing method for the decision they need to make.
A franchise team comparing three possible territories does not need a national TAM slide.
A local SEO agency scoping a campaign does not need a global industry number.
A small business owner deciding between two neighborhoods does not need a 40-page market report before making a first-pass decision.
They need a bottom-up local estimate that shows supply, competitor strength, demand assumptions, and realistic room to win.
The fix is to separate this article’s use case clearly.
Use this method for go/no-go local decisions.
Do not use it as the only source for a funding round, board presentation, or national TAM claim.
Step 1: Draw the Trade Area by Drive Time, Not a Radius Circle
The first step in local market sizing is defining the trade area. If the boundary is wrong, every competitor count, population estimate, and revenue assumption after it becomes weaker.
The common mistake is drawing a flat 3-mile or 5-mile radius around a location.
That looks simple, but customers do not travel in perfect circles. They travel by road access, traffic, parking, transit, convenience, and travel time.
A 10-minute drive-time area can cover a few blocks in a dense city and several miles in a suburban or rural market.
That difference changes the number of people, competitors, and comparable businesses inside the market.
These are starting points, not fixed rules.
A convenience category usually needs a shorter trade area.
A destination category can justify a longer trade area.
The fix is to define the market by drive time or a carefully drawn trade boundary before you pull competitor data.
For a first-pass go/no-go estimate, a basic drive-time boundary or isochrone tool is enough. You do not need enterprise GIS software just to avoid the radius-circle mistake.
Step 2: Pull Every Competitor and Comparable Inside That Boundary
The competitor set is the supply side of the local market. You need to know how many businesses already serve the category inside the trade area before estimating how much room is left.
This is where manual research usually breaks.
A person opens Google Maps, searches a category, copies a few business names, checks ratings, checks websites, copies phone numbers, and stops when the work becomes repetitive.
That creates a partial market view.
A partial view can make a crowded market look open.
It can also make an open market look empty if the wrong category terms or locations were searched.
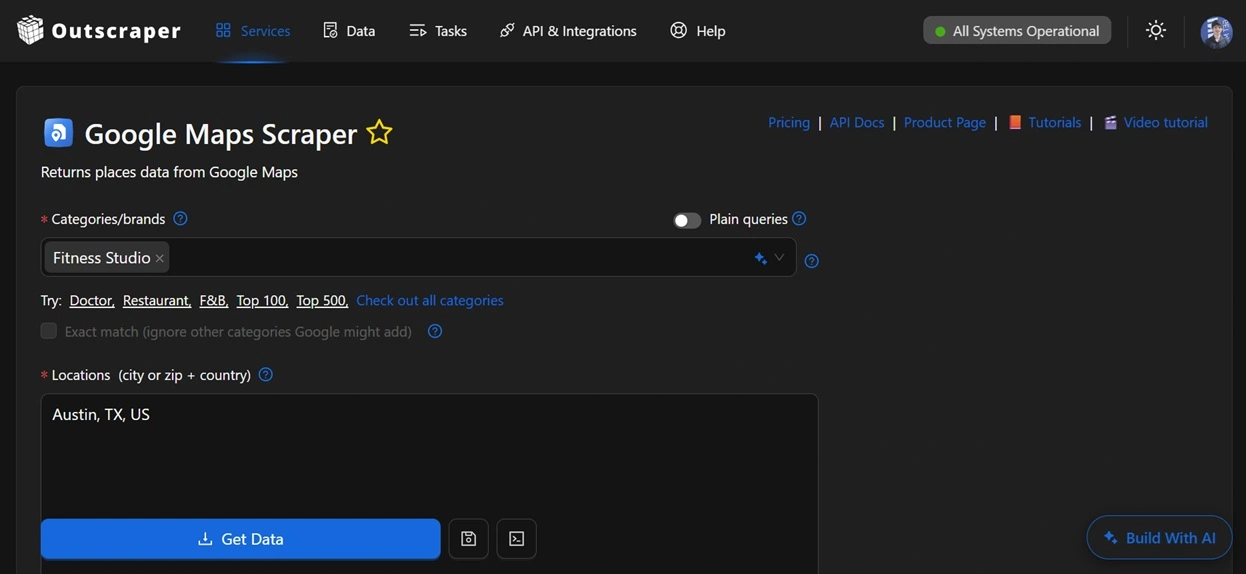
A better workflow is to collect structured Google Maps business data for the category and trade area.
Before collecting the records, review which Google Maps business data fields support market analysis so each column has a defined purpose.
Use the Google Maps Scraper to collect competitor records with fields like:
- business name
- category
- address
- website
- phone number
- rating
- review count
- business status
- Google Maps URL
- opening hours
- location data


The goal of this step is not to call the business count “demand.”
The goal is to build the supply map.
Use Outscraper to collect Google Maps business records inside your target category and location before building the estimate. This solves the first major market-sizing problem,
You stop guessing how many competitors exist.
Step 3: Rank Competitors by Relative Strength, Not Revenue
Review count helps rank competitors, but it should not be treated as revenue. A business with more reviews is not automatically making more money than every lower-review competitor.
This is one of the biggest mistakes in local market sizing.
Review behavior changes by category.
Restaurants and cafes often collect many reviews because customers visit frequently and review casually.
Dentists, HVAC companies, accountants, legal services, and B2B providers may have fewer reviews even when revenue is high.
That means review count is not a demand number.
It is a relative visibility signal inside the same category and area.
Use reviews to answer:
- Which competitors have the strongest local presence?
- Which businesses dominate attention in this category?
- Which locations have unusually high or low review volume?
- Which competitors may be stronger than a simple count suggests?
- Which market has one dominant player versus a fragmented field?
A cleaner way to use reviews is to calculate share of voice:
This does not mean Competitor A earns 40% of the revenue.
It means Competitor A owns 40% of the review visibility in that local category.
The fix is to separate what each metric can and cannot prove.
This keeps the estimate honest.
Step 4: Get Population and the One Number That Is Not Usually Free
Public business data shows local supply. It does not show full market demand by itself. To size the market, you still need population, income, category penetration, and average spend inputs.
This is where many estimates fall apart.
Teams get the competitor count, look at reviews, and jump straight to a revenue number.
That skips the demand layer.
A defensible local market estimate needs these inputs:
Be clear with clients or stakeholders here.
Everything through population and income can often be gathered from public or free sources.
The input that usually needs a paid source, internal benchmark, or clearly labeled estimate is category penetration.
Category penetration answers:
What percentage of people or households in this trade area are likely to buy this category?
Not every person in a trade area buys boutique fitness, dental implants, accounting services, med spa treatments, HVAC services, or legal services in a given year.
If you guess category penetration without labeling it as an estimate, the entire model becomes weak.
The fix is to label every input by source type.
This makes the estimate easier to defend because the assumptions are visible.
Step 5: Calculate SAM, Then a Weighted SOM
SAM shows the serviceable available market inside the trade area. SOM shows the realistic share of that market a business can capture after considering competitor strength.
The common mistake is splitting the market evenly.
If there are 9 competitors, the weak shortcut is:
100% divided by 9 = 11.1% per business.
That looks clean, but it is rarely realistic.
One competitor may dominate local visibility.
Another may have a better location.
A new entrant usually does not capture an even share in year one.
Use this structure instead:
Worked Example
This example is illustrative. Replace it with a real scrape, sourced penetration rate, and real spend input before using it in a client report.
The flat split makes the market look bigger than the first-year capture is likely to be.
The weighted SOM is more conservative because it reflects competitor strength.


Review the available fields before building your local market model.
Step 6: Compare Markets Before Picking One
A single local market estimate is useful, but comparing two or three trade areas is stronger. The same model can show which area has more realistic room to enter.
The problem with one-market analysis is that it has no reference point.
A market with 12 competitors may look crowded until another nearby market has 35 competitors.
A market with low review volume may look weak until you see that every competitor in the category has low review volume.
A market with fewer competitors may still be difficult if one player dominates local visibility.
Use the same model across each candidate area.
Area C has fewer competitors, but one dominant competitor controls visibility.
Area B has more competitors, but the market is more fragmented.
Area A may be acceptable, but it may not be the strongest choice.
The fix is to compare markets before making the decision.
The goal is not to make the number look bigger.
The goal is to choose the market with the clearest path to capture share.
Where This Method Still Breaks
This method breaks when teams treat estimates as facts, use the wrong boundary, or skip the demand input. Public business data improves the supply-side estimate, but it does not remove the need for judgment.
The biggest risk is false precision.
A spreadsheet can make a weak assumption look scientific.
That does not mean the assumption is good.
Here are the failure points to check before using the number:
The fix is to label each number clearly:
- observed public data
- sourced demographic data
- trade report input
- internal benchmark
- estimate
That makes the final number more useful and more honest.
How Outscraper Fits in the Market Sizing Workflow
Outscraper helps with the local business data layer of market sizing. It does not replace census data, trade reports, or business judgment.
Its role is to make the supply side faster and cleaner.
Instead of manually copying businesses from Google Maps, Outscraper helps collect structured business records by category and location.
For this workflow, the useful Outscraper pages are:
- Google Maps Scraper for collecting competitor records
- Google Maps Scraper V2 for reviewing available business data fields
- Pricing for checking cost before scaling data collection
- Best Google Maps Scrapers for comparing scraping options and tradeoffs
The workflow is:
Define trade area → collect business data → rank competitors → add demand inputs → calculate SAM → weight SOM → compare markets
That is more defensible than guessing from a national average.
It is also more practical than manually copying every competitor into a spreadsheet.
Final Takeaway
Sizing a local market with public business data is not about finding one perfect number.
It is about replacing guesswork with a defensible range.
Start with the trade area.
Pull the competitor set.
Use reviews for relative strength, not revenue.
Add population, income, category penetration, and spend.
Calculate SAM.
Weight SOM based on competitor strength.
Then compare markets before making the decision.
The number will still have assumptions.
But the assumptions will be visible.
That is what makes the estimate useful.
A local market size estimate should help someone decide what to do next:
enter the market, avoid the market, compare another territory, or collect better data.
That is the point.
Not a bigger number.
A better decision.
Use Outscraper to pull competitor records, ratings, reviews, websites, phone numbers, and location data before you calculate opportunity.
Frequently Asked Questions
Most frequent questions and answers
You size a local market by defining a trade area, counting competitors, adding population and income data, estimating category penetration, calculating serviceable available market, and weighting realistic share by competitor strength.
Public business data such as business name, category, address, rating, review count, website, phone number, business status, and location can help map local supply and compare competitor strength.
Google review counts should not be used as direct market demand or revenue. They are better used as a relative visibility signal within the same category and trade area.
A radius is often too simple because customers travel by roads, time, traffic, and convenience. A drive-time boundary usually gives a better trade area for local market sizing.
SAM is the serviceable available market inside the trade area. SOM is the realistic share of that market a business can capture after considering competitor strength, visibility, and entry position.