Table des matières
Market research gets slow when done manually, et l' the work lives in browser tabs and spreadsheets. You end up copying the same fields, cleaning messy rows, and re-checking competitors every time the market shifts. By the time the sheet looks “done,” the data is already out of date.
Outscraper helps you collect competitor and customer data from public sources like Google Maps, reviews, Google search results, and export it for analysis. Run a pull, export a clean file, and start working in minutes. No code needed. Outscraper’s business data and enrichment platform handles common blocking issues in the background, including CAPTCHA checks.
TL;DR
If you only read one section, read this:
- Utilisation Google Maps to map competitors, categories, attributes, and coverage.
- Utilisation Critiques to find repeat complaints and praise you can turn into messaging.
- Utilisation Search results to see who wins high-intent keywords in a market.
- Export to CSV/XLSX/JSON, analyze, then re-run the same pull to keep it current.
This guide demonstrates how to use web data for market research, enabling you to establish a baseline dataset and continually update it over time.
Proof: Manual Work Adds Up
Manual data entry costs U.S. businesses an average of $28,500 per employee annually, driven by time spent copying information between emails, PDFs, and spreadsheets. Separately, Paycom’s research on HR workflows found that each manual data entry can cost $4.86-$5.68 per instance, which compounds quickly when you’re handling thousands of records.
Why Market Research Needs Web Data
Traditional market research is slow by design. Reports take weeks or months, and by the time you read them, competitors have changed prices, added locations, and picked up new reviews.
Surveys and interviews still matter, but they are based on what people say they do. Public web data shows what is actually happening. Listings update. Prices change. Reviews explain why customers stay or leave. When you collect that data in bulk, you stop debating opinions and start working with patterns.
Outscraper helps you turn public sources into a dataset you can sort, filter, and compare, then re-run whenever the market shifts.
What Market Research Means Today
Market research is not a one-time project. Most teams need a repeatable way to check the market, not a PDF that goes stale.
Instead of doing a “big research sprint” once a year, you can pull a fresh snapshot weekly or monthly and track:
- Rating and review volume changes in a category
- New competitors appearing in a neighborhood
- Pricing shifts and promos.
This is how market research becomes a routine you can maintain.
What Web Data Adds That Surveys Can’t
Surveys reveal what people claim to want. Web data shows what they complain about, what they praise, and what they pay for. For many teams, this becomes lightweight competitive intelligence that can be refreshed monthly.
For example, in a focus group, people might say they care about “quality.” But if you analyze 5,000 Google Maps reviews, you may find the recurring pain is “slow delivery,” or “no response.”
Web data is useful because it gives you:
- Speed: Pull thousands of price points in minutes, not weeks.
- Scale: Analyze every business in a city or ZIP code.
- Signal: Repeated review themes and pricing patterns show up quickly.
Next, let’s look at the specific market research questions web data can answer.

What Web Data Can Answer
The examples below use Outscraper exports, but the point is bigger than any tool. When you move from manual research to exported datasets, you stop relying on a few examples and start measuring patterns across the whole market.
Competitor Landscape
This is the base dataset for competitor analysis, especially when you’re entering a new city or category. When you enter a new city or category, the first question is simple: who’s already winning, and why?
Pull business listings to see:
- Who has the highest review volume and ratings
- Who is adding new locations, and where
- Which categories are crowded vs underserved
You can also re-run the same pull monthly to track who is gaining reviews fastest, not just who started first.
Pricing & Offers
Pricing research answers a simple question: what are competitors charging, and how often do they change it? When you collect pricing and offer pages in one dataset, you can compare price ranges, packages, and promos without relying on screenshots that go stale.
You’re planning a price change for “house cleaning” in Chicago. Pull pricing pages from 20 to 100 competitors and export columns like brand, package name, price, billing period, promo text, city or area, and page URL. Group by package type (basic, deep, move-out), then compare price ranges and discount frequency. That gives you a realistic pricing groupe before you set your own.
You can pull and export this with Outscraper, then refresh the same dataset weekly or monthly. If you rerun the same pull monthly, it becomes simple price monitoring.
Customer Sentiment
Customer sentiment is easier to measure when you stop relying on a few stories and screenshots. Reviews show what customers praise, what they complain about, and what they expect for the price. When you export review text and ratings in one dataset, you can group feedback into themes et l' see what comes up most often.
You’re searching for “plumbers in Dallas.” Pull reviews for the top businesses in the area and étiquette themes like response time, pricing transparency, and communication. If the same complaints repeat across competitors, you get clear direction on what to fix and what to promise.
That can shape your messaging, your service standards, and what you prioritize next. When you refresh it monthly, you get ongoing review monitoring for key competitors.
Demand Signals & Trends
Listings and search results can show where interest is building before it shows up in a quarterly report. They are not perfect demand measures, but they are useful early signals. It’s basic trend analysis using listings and search visibility as early signals.
You can track:
- How many new businesses appear in a category over time
- Which neighborhoods are adding new entrants
- Which brands consistently rank in search for high-intent keywords
If you refresh the same pulls monthly, you can spot categories that are heating up, areas getting more crowded, and competitors gaining visibility.
Market Mapping
Location data helps you spot gaps that averages hide. Map competitors by area, then compare how many options exist versus how strong they look.
Look for:
- Areas with high visibility but few high-rated providers
- Areas with many listings but weak ratings
- Pockets missing a category or service
This makes it easier to pick where to expand, where to run ads, and what to lead with.
Next, we’ll look at which sources to pull from and what each one is best for (Google Maps, Reviews, Search results, and any website).
Sources You Can Pull From
Good market research comes from combining signals. One source tells you what exists. Another tells you what customers think. Another shows who gets attention. Review themes and SERPs are also useful for product research and product discovery, especially when you’re validating features and messaging.
Outscraper lets you pull from these public sources and export the results into a file you can measure and compare.
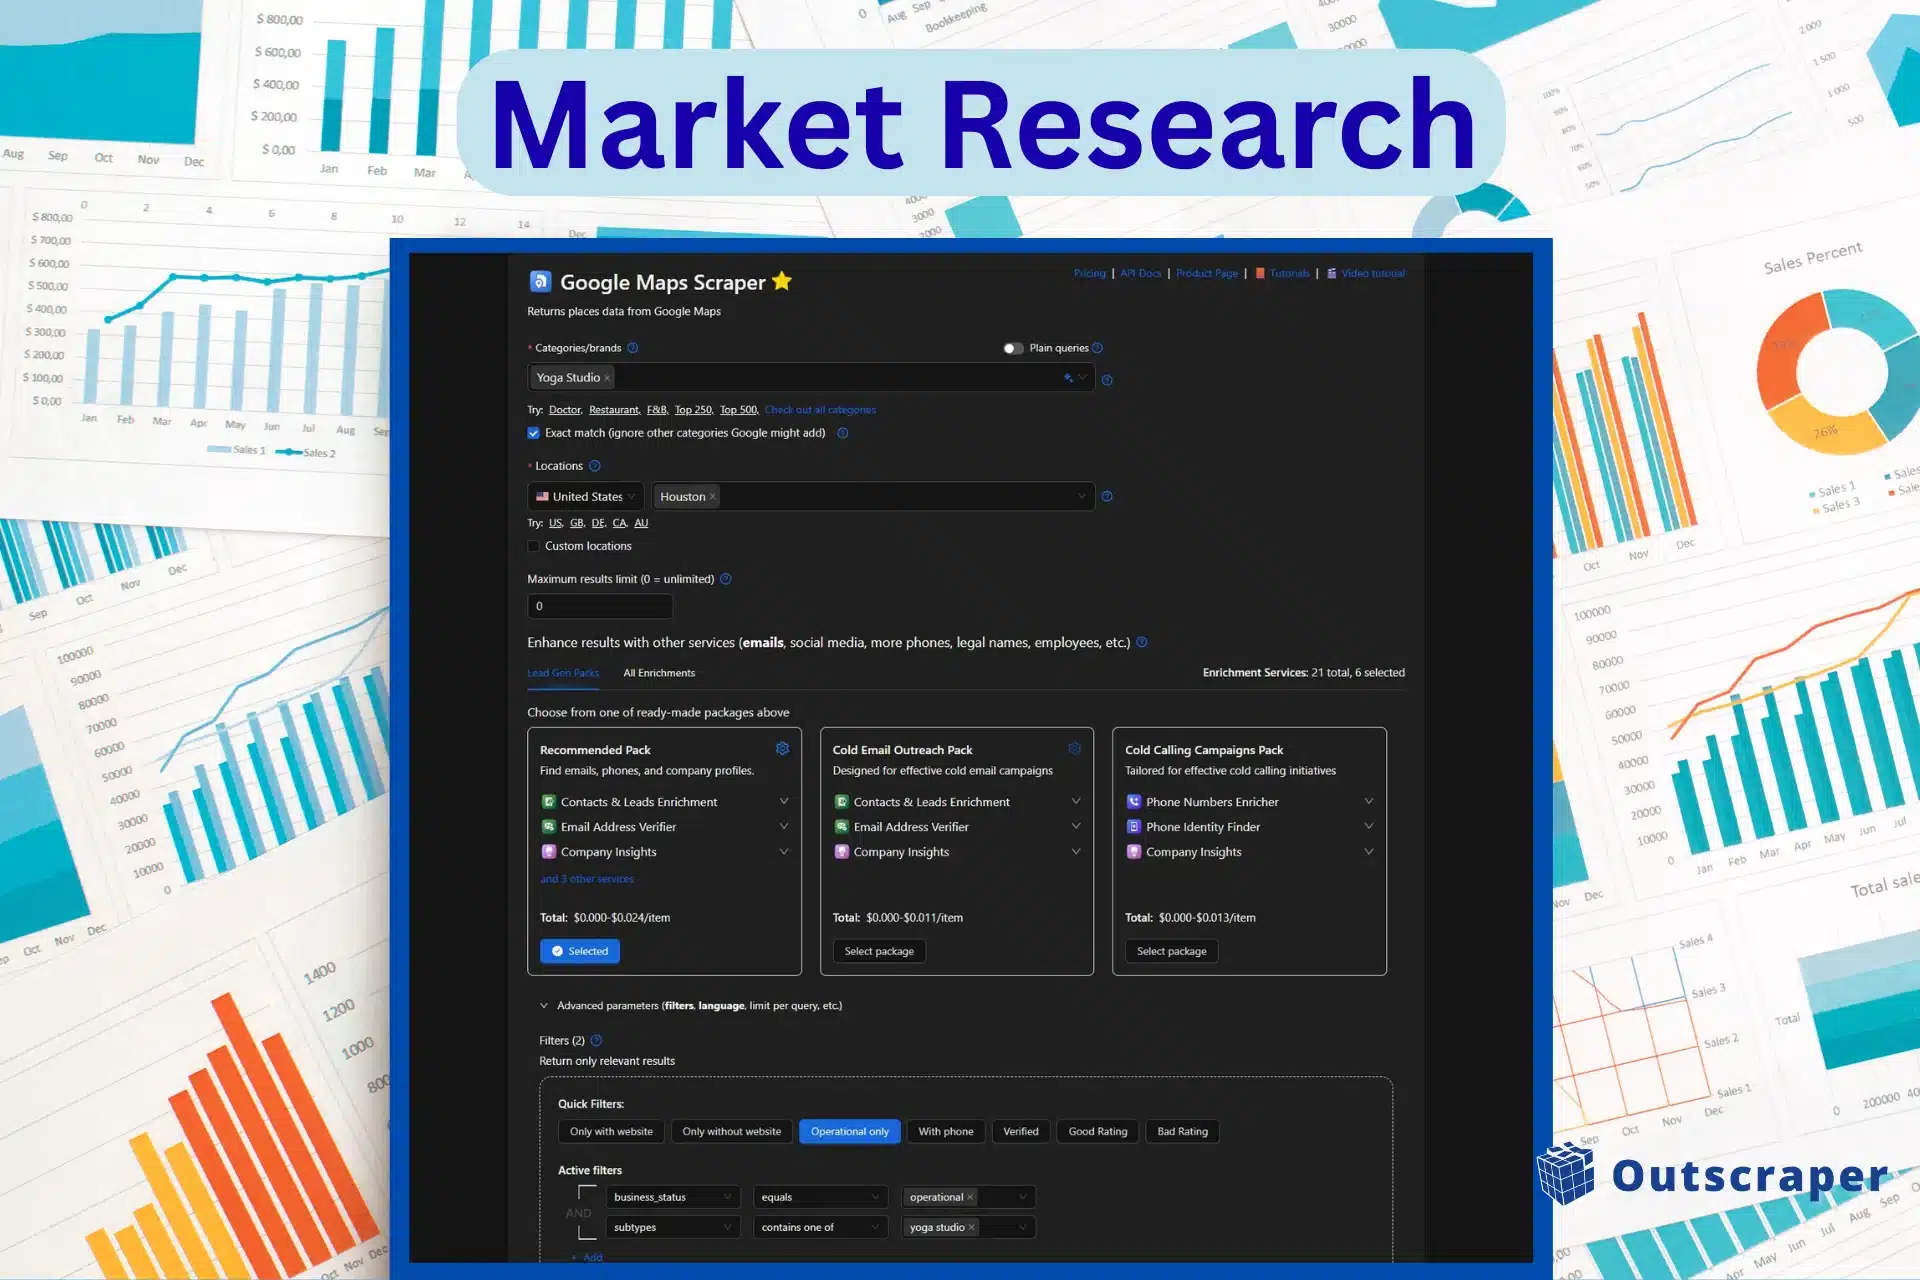
Google Maps (Places, Categories, Attributes)
Google Maps is a strong starting point for local market research. It helps you see how crowded a category is in a city and how each business presents itself.
Use it to pull fields like category, address, phone, website, hours, rating, review count, and attributes such as “wheelchair accessible” or “outdoor seating”. With that, you can spot gaps like areas with high demand but few high-rated options, or categories that are packed in one neighborhood and thin in another. Recommended Tool: Le Scraping Google Maps
Reviews Platforms (Google, Trustpilot, and More)
Reviews are where you find the reasons behind ratings. They show what customers praise, what they complain about, and what they expect for the price.
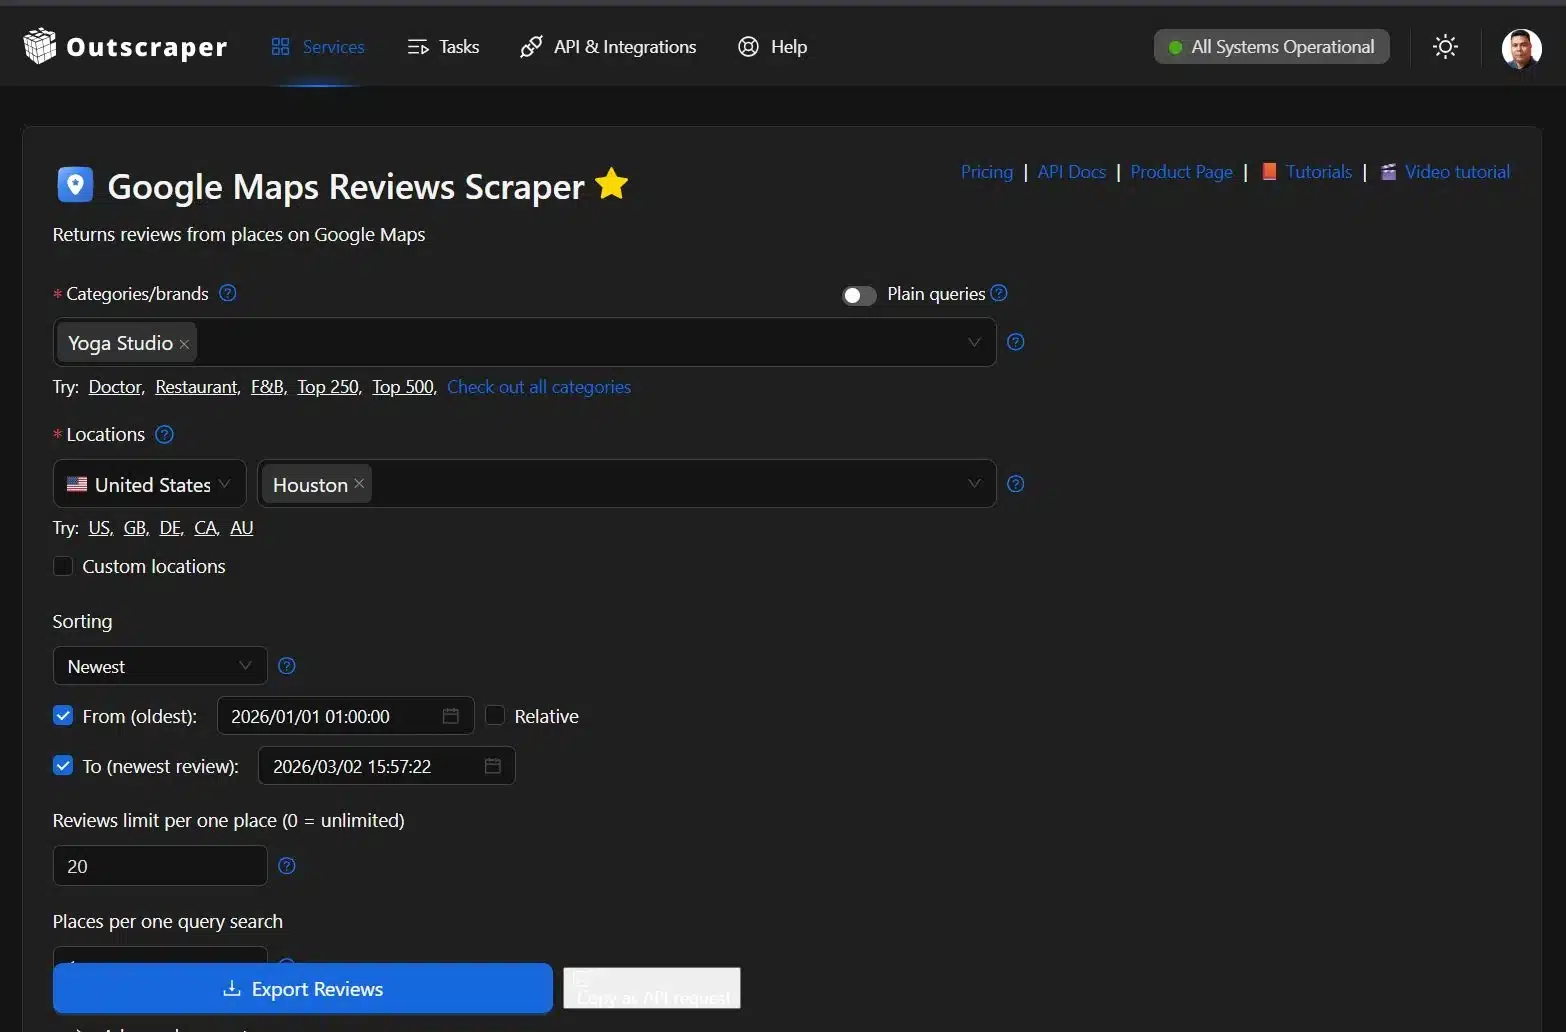
Pull review text and ratings at scale, then group feedback into themes like response time, pricing transparency, reliability, and support. This is useful for messaging, positioning, and product decisions because it is based on repeated patterns, not a few loud opinions. Recommended Tool: Le Scraping d'avis Google Maps
SERPs / Search Results
Search results show who owns high-intent queries. They also show what Google is rewarding for a topic in a market right now.
Pull SERPs for your keywords and locations to see which competitors rank, what pages they use, and what formats show up often (maps, ads, product pages, list posts). This helps you find content gaps, spot aggressive advertisers, and choose keywords that match buyer intent. Recommended Tool: Le Scraping de recherche Google
Any Website via Universal AI Scraper
Some markets live on niche directories and marketplace sites. The Universal AI Scraper is for those use cases.
An AI scraper reads a page like a person and turns it into structured rows you can export. Use it when the site layout is inconsistent or the data is buried in listings that do not follow a clean pattern. Recommended Tool: Universal AI Scraper
The No-Code Workflow (Step-by-Step)
You do not need to be a developer to run market research with web data. The goal is to go from blank page to a usable dataset fast. The steps below use Google Maps scraper as an example.
Other scrapers follow the same idea, but the inputs can change. For example, a Search scraper starts with keywords, and the Universal AI scraper starts with URLs.
Step 1: Define Your Market Slice
Start with two decisions: where et l' what.
Pick a geography and a category, then narrow it down. Be specific. If you are researching the fitness market in Houston, don’t just search for “gyms.” Look for “CrossFit,” “Pilates,” or “Yoga studios” so the results reflect the competitors that matter.
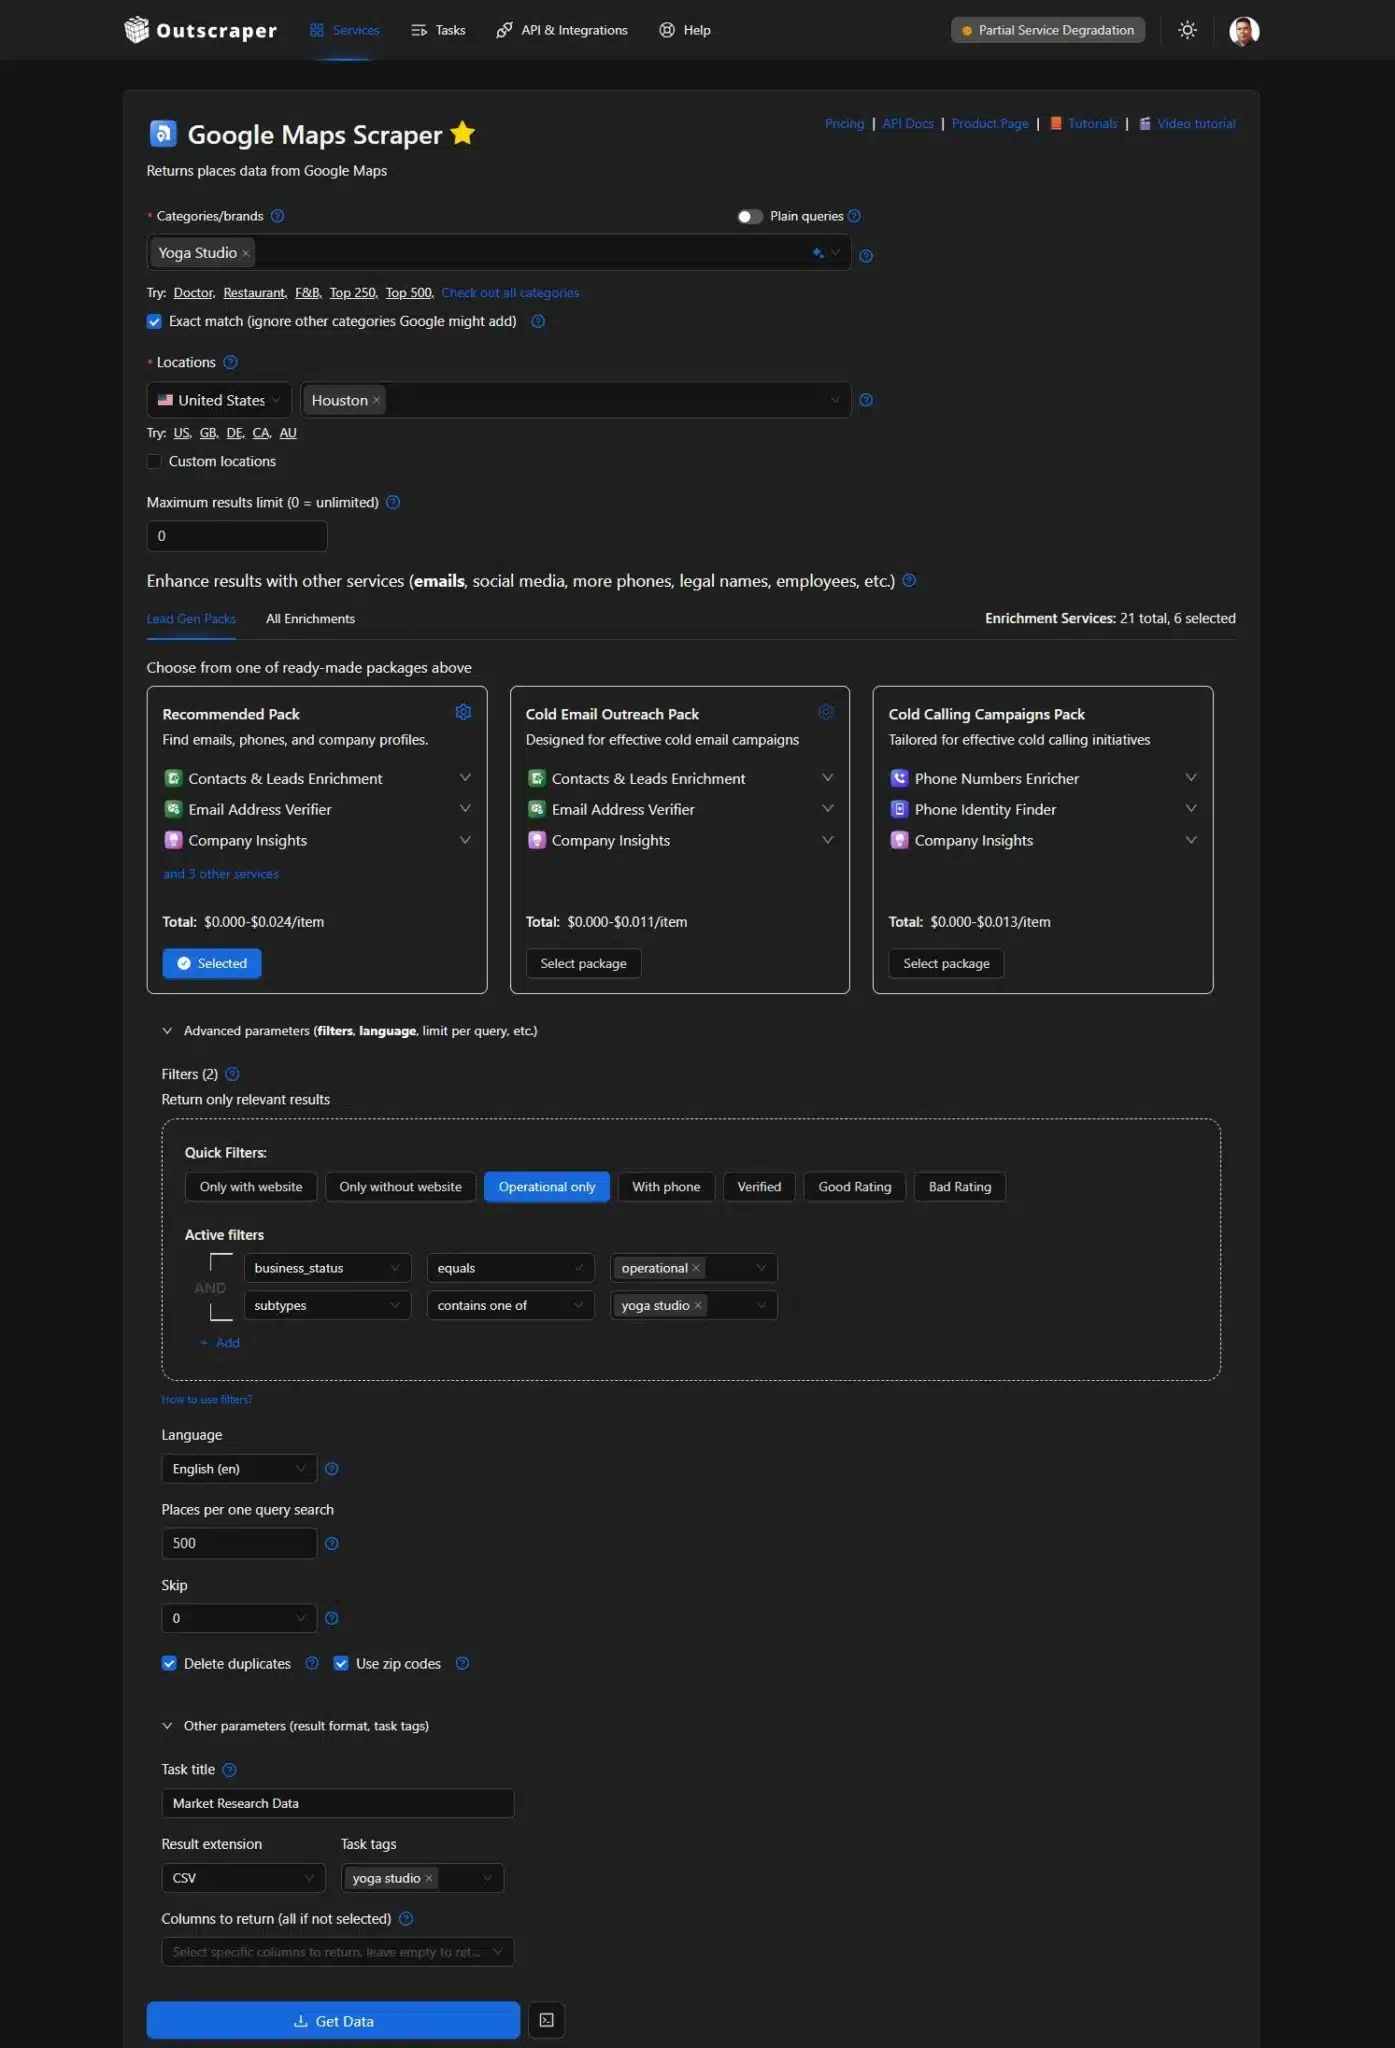
Run small first. Pull a few hundred results, check the output, and then scale up. Check the “Exact Match” option to ignore other categories Google might add. If you’re not selecting categories, you can also toggle “Plain Queries,” but you need to input the search keywords, Place IDs, URL, etc.
Step 2: Collect Structured Data
Run the task and export the results. Structured data is information arranged in clean columns, like a spreadsheet.
Instead of copying from a web page, you get a file with consistent fields such as business name, category, address, phone, website, rating, and review count. That makes it easy to sort, filter, and compare.
Before running, you can set output/organization options such as Result extension (CSV), task title, task tags, and columns to return. Then you run it via the main action, the Get Data bouton.
Step 3: Enrich for Research-Ready Datasets
A list of businesses is a starting point. If your research needs contact or profile details, you can enrich the dataset. The enrichment is optional, but if you need to enhance results with other services like the Lead Gen Packs, which will give you Contacts & Leads enrichment, an email address verifier, and company insights.
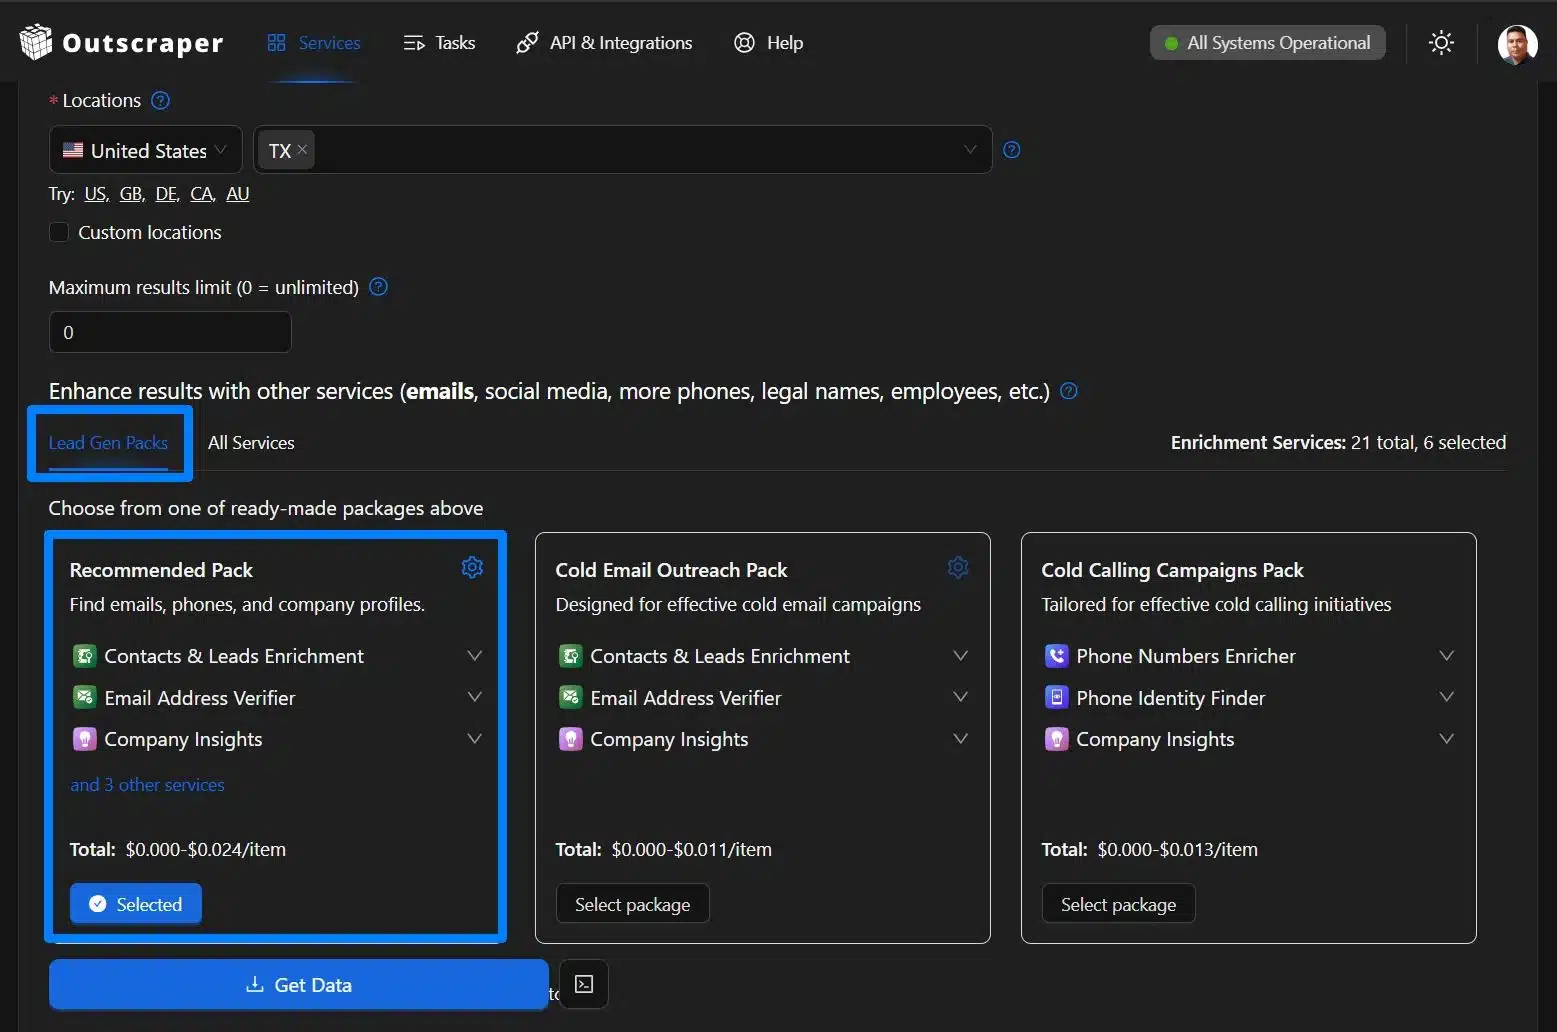
Common data enrichments include adding emails, social links, and extra metadata, plus removing duplicates. If you use verifiers, they help confirm that contact fields are still active, so you are not working with dead rows.
Optional: Filters and Advanced Settings
Use advanced options when you need to narrow the dataset before exporting.
Common filters include:
- Quick filters (Only with website, Only without website, Operational only, With Phone, Verified, Good Rating, Bad rating).
- Language
- Endroits par recherche d'une seule requête
- Skip (pagination)
- Delete duplicates
- Use ZIP codes
Make sure to check the delete duplicates and use the ZIP codes option if you want to get all the data within a specific city. For easier reference of your task, you can add a task title, results extension, and task tags. If you only need specific fields, return only the columns you plan to analyze.
Step 4: Analyze & Visualize
Move the export into the tool you already use, such as Google Sheets, Excel, or a Business Intelligence tool.
From there, you can build simple views like:
- Competitor density by neighborhood
- Rating distribution by category
- Top competitors by review volume
- Gaps where many listings exist, but ratings are weak
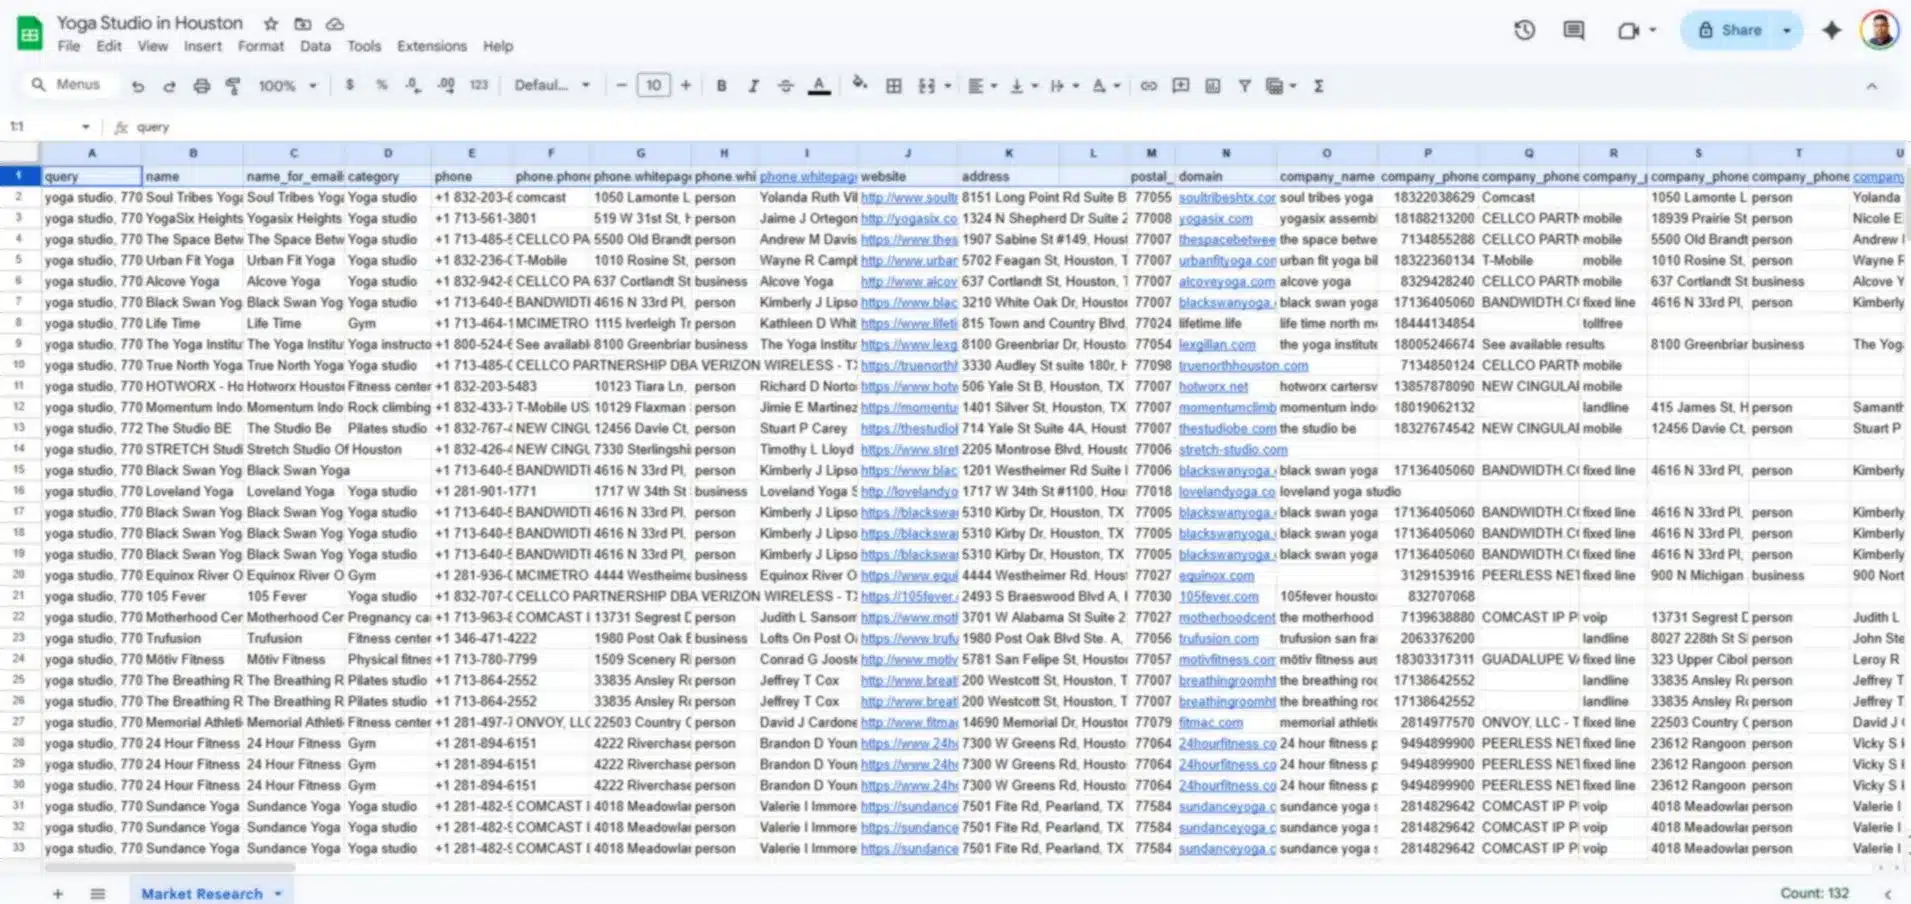
Step 5: Monitor Changes
Markets change every day. New competitor appears, ratings shift, and pricing pages update.
You can set up recurring pulls to refresh your dataset on a schedule. Instead of rebuilding the sheet each month, you can update the same analysis with new rows. This turns a one-off market research into an ongoing monitoring system.
Use Case Playbooks
Market research data is only useful if it changes a decision. These playbooks show what to pull, what to measure, and what to do next. Each one can start with a small export and scale up once the output looks right.
Market Sizing with Google Maps Categories
Goal: Estimate Total Addressable Market (TAM).
Pull all businesses in a category across your target locations, then count how many active listings exist by city, ZIP code, or neighborhood. Export a file with business name, category, address, rating, review count, and status so you can segment and remove non-useful data. Use this as a quick TAM analysis proxy by category and geography.
Decision: Whether a region looks saturated, where coverage is thin, and where to test first before spending on ads or sales.
Competitor Benchmarking (Ratings, Review Volume, Attributes)
Goal: See what “good” looks like and who sets the baseline for trust.
Export competitor listings and compare ratings ranges, review counts, recency of reviews, and key attributes (services, amenities, verified status). This helps you separate “lots of listings” from “strong operators customers trust.”
Decision: Your positioning angle, what you need to improve, and which competitors to monitor.
Pricing Intelligence
Goal: Ste pricing using current market behavior and track promos across multiple sites.
Pull pricing or offer pages from a defined competitor list, then export price, package name, billing period, promo text, and page URL with a date stamp. Refresh the same pull monthly so you can see who discounts often and what price ranges are stable.
Decision: Your pricing band, promo timing, and which packages to lead with.
Voice of Customer (VoC)
Goal: Turn review patterns into messaging and improvements.
Export review text, rating, date, business name, and location. Tag themes like response time, pricing clarity, reliability, and support, then compare what shows up in low ratings versus high ratings.
Decision: What to promise in marketing, what to fix operationally, and what to prioritize next.
Launch Planning
Goal: Choose a launch area and message that fits local conditions.
Combine competitor density and quality by area (listings, ratings, review volume) with search results for your core keywords. You are looking for places where demand signals are present but existing options are weak or inconsistent.
Decision: Where to start, what to offer to test first, and what message to lead with.
Lead List for Research Interviews
Goal: Recruit the right people for interviews to validate assumptions.
Build a list of active businesses in your target category and location, then prioritize ones with recent reviews. and complete profiles. Export contact fields where available, plus activity signals, so outreach is targeted and you are not guessing who is still operating.
Decision: Who to interview, what questions to ask based on the data patterns, and what assumptions to confirm before committing budget.
Why Outscraper Over Alternatives (And Getting Started Fast)
For market research, the tool matters less than the workflow. You want to pull public data, export it, and refresh when the market changes, without turning it into a project or a maintenance job.
If you’re comparing tools like Apify, BrightData, Octoparse, or Oxylabs, the main difference is where you want to spend time. Some platforms are great when you need custom scraping logic, heavy proxy infrastructure, or developer-first workflows. Outscraper Business Data and Enrichment platform is built for teams that want a fast path from question into export and then analysis.
Why Teams Choose Outscraper
- Fast path to usable export: Run a task, export the results, and start analyzing. You can export to CSV, XLSX ou JSON (a simple text format for data).
- Less scraping maintenance: Outscraper handles common blockers in the background. A proxy routes requests through different IP addresses to avoid blocks, CAPTCHA (“prove you’re human” checks site web use to slow automated tools).
- Clear, usage-based pricing: You can start small, validate the output, then scale. You pay based on usage plutôt que buying a platform you are not sure you need yet.
Pricing That Scales With You
We believe you should see the value before you open your wallet. That is why our onboarding is built around speed and transparency.
- Start on Free Tier and Test First: You can test your ideas with our free monthly allowance. There is no credit card required to get started. This allows you to run a few small tasks, check the data quality, and see if the output fits your research needs.
- Pay for Results, Not Setup: Market research is rarely one-and-done. Pricing feels predictable when you can rerun the same pull weekly or monthly et l' control the scope.
Getting Started Fast
- Pick the sources that match your question: Maps for competitors list, Reviews for themes, Search results for visibility, Universal AI for niche directories et l' marketplaces.
- Run a small pull first and confirm the columns you need.
- Export to CSV or XLSX, build your baseline, and rerun on a weekly or monthly schedule.
FAQ
Questions et réponses les plus fréquentes
Competitor coverage by area, pricing ranges and promos, review themes that drive churn, visibility for high-intent keywords, and market gaps where options are weak or missing.
Competitor lists (Maps), pricing checks (web pages or directories), review theme analysis (Reviews), and visibility research from search results (Search results). Most teams start with one dataset, then rerun it monthly to track changes.
Use Google Maps categories as a TAM proxy. Pull all businesses in a category for your target region, remove duplicates, and segment counts by city or ZIP code to see density and saturation.
No. You can run scrapes in the browser and export the results. An API is available if you want to automate, but it is optional.
Your export reflects what is publicly available at the time you run the pull. If you need ongoing visibility, rerun the same pull weekly or monthly to refresh your baseline.
Start with specific categories and locations, run a small sample first, and use “delete duplicates” where available. Keeping the same inputs each run also makes month-over-month comparisons cleaner.


