İçindekiler

Pazar araştırması alır manuel olarak yapıldığında yavaş, ve eser hayatlar tarayıcı sekmelerinde ve elektronik tablolarda. Piyasa her değiştiğinde aynı alanları kopyalamak, dağınık satırları temizlemek ve rakipleri yeniden kontrol etmek zorunda kalıyorsunuz. Tablo “tamamlanmış” gibi göründüğünde, veriler çoktan güncelliğini yitirmiş oluyor.

İletişim halka açık kaynaklardan rakip ve müşteri verilerini toplamanıza yardımcı olur gibi Google Haritalar, yorumlar, Google arama sonuçları ve bunları analiz amacıyla dışa aktarın. Bir çekme işlemi gerçekleştirin, temiz bir dosya dışa aktarın ve dakikalar içinde çalışmaya başlayın. Hayır kod gereklidir. Outscraper’ın iş verileri ve zenginleştirme platformu, CAPTCHA kontrolleri de dahil olmak üzere yaygın engelleme sorunlarını arka planda halleder.

Market research and its uses
Outscraper kullanılarak pazar araştırması nasıl yapılır?

Özetle

Eğer sadece bir bölümü okuyacaksanız, bunu okuyun:

  • Kullanmak Google Haritalar rakipleri, kategorileri, özellikleri ve kapsama alanını haritalandırmak.
  • Kullanmak Yorumlar ...'ye tekrar bul şikayetlerinizi ve övgülerinizi şuna dönüşmek mesajlaşma.
  • Kullanmak Arama sonuçları bir pazarda satın alma niyeti yüksek anahtar kelimelerde kimin üst sıralarda yer aldığını görmek için.
  • Şuraya aktar: CSV/XLSX/JSON, analiz etmek, sonra Aynı çekme işlemini tekrar çalıştırarak verileri güncel tutun.

Bu kılavuz, nasıl kullanılacağını göstermektedir pazar araştırması için web verileri, böylece bir temel veri kümesi oluşturmanıza ve bunu zaman içinde sürekli olarak güncellemenize olanak tanır.

Kanıt: El Emekli İşlerin Toplamı

Manuel veri girişi, ABD’deki işletmelere ortalama olarak Çalışan başına yıllık 28.500 dolar, tarafından yönlendirilen E-postalar, PDF’ler ve elektronik tablolar arasında bilgi kopyalamak için harcanan zaman. Bununla birlikte, Paycom’un İK iş akışlarına ilişkin araştırması, her bir manuel veri girişinin maliyeti $4.86-$5.68 her örnek için, ki bu durum hızla artar, çünkü sen binlerce kaydı işlemek.

Pazar Araştırmasında Web Verilerinin Önemi

Geleneksel pazar araştırması, doğası gereği yavaş bir süreçtir. Raporların hazırlanması haftalar ya da aylar sürer ve siz bunları okuduğunuzda rakipleriniz fiyatları değiştirmiş, yeni şubeler açmış ve yeni yorumlar almış olur.

Anketler ve görüşmeler hâlâ önemlidir, ancak bunlar insanların yaptıklarını söylediklerine dayanır. Halka açık web verileri ise gerçekte neler olup bittiğini gösterir. İlanlar güncellenir. Fiyatlar değişir. Yorumlar, müşterilerin neden kaldığını ya da ayrıldığını açıklar. Bu verileri toplu olarak topladığınızda, görüşler üzerinde tartışmayı bırakıp kalıplar üzerinden çalışmaya başlarsınız.

Outscraper, halka açık kaynakları sıralayabileceğiniz, filtreleyebileceğiniz ve karşılaştırabileceğiniz bir veri setine dönüştürmenize yardımcı olur; böylece piyasa değiştiğinde bu veri setini yeniden çalıştırabilirsiniz.

2026 Yılında ve Sonrasında Pazar Araştırması Nedir?

Pazar araştırması tek seferlik bir proje değildir. Çoğu ekibin, geçerliliğini yitiren bir PDF dosyası yerine, pazarı takip etmek için tekrarlanabilir bir yönteme ihtiyacı vardır.

Yılda bir kez “büyük bir araştırma sprinti” yapmak yerine, haftalık veya aylık olarak güncel bir durum değerlendirmesi yapabilir ve şunları takip edebilirsiniz:

  • Bir kategorideki puanlama ve yorum sayısındaki değişiklikler
  • Bir mahallede ortaya çıkan yeni rakipler
  • Fiyat değişiklikleri ve promosyonlar.

İşte bu şekilde pazar araştırması, sürdürebileceğiniz bir rutin haline gelir.

Anketler ile Web Verileri Arasındaki Fark

Anketler, insanların ne istediğini söylediklerini ortaya koyar. İnternet verileri ise neyden şikayet ettiklerini, neyi övdüklerini ve ne için para ödediklerini gösterir. Birçok ekip için bu, basit bir süreç haline gelir rekabet istihbaratı aylık olarak güncellenebilir.

Örneğin, bir odak grubunda katılımcılar “kalite”ye önem verdiklerini söyleyebilirler.” Ancak 5.000 Google Haritalar yorumunu incelerseniz, en sık karşılaşılan şikayetin “yavaş teslimat” olduğunu görebilirsiniz”y," ya da “yanıt yok.”

Web verileri, size aşağıdakileri sağladığı için yararlıdır:

  • Hız: Binlerce fiyat verisini haftalar değil, dakikalar içinde alın.
  • Ölçek: Bir şehirdeki veya posta kodundaki her işletmeyi analiz edin.
  • Sinyal: Tekrarlanan inceleme konuları ve fiyatlandırma eğilimleri kısa sürede ortaya çıkıyor.

Şimdi, hadi bakın Web verilerinin yanıtlayabileceği belirli pazar araştırması soruları.

xlsx
demo_restaurants.xlsx
Google Haritalar'daki mekanlar - restoranlar Kazınmış Google Haritalar verileri

Web Verileri Hangi Sorulara Cevap Verebilir?

Aşağıdaki örneklerde Outscraper'dan alınan veriler kullanılmaktadır, ancak asıl mesele herhangi bir araçtan öte bir konudur. Manuel araştırmadan dışa aktarılmış veri kümelerine geçtiğinizde, birkaç örneğe dayanmaktan vazgeçer ve tüm piyasa genelindeki eğilimleri ölçmeye başlarsınız.

Rakip Ortamı

Bu, şunun temel veri kümesidir: rakip analizi, özellikle de yeni bir şehre ya da kategoriye girdiğinizde. Yeni bir şehre ya da kategoriye girdiğinizde, ilk soru basittir: Kimler halihazırda başarılı ve bunun nedeni nedir?

İşletme kayıtlarını görüntülemek için:

  • En fazla yorum sayısı ve en yüksek puanlara sahip olan kimdir?
  • Yeni konumları kim ekliyor ve bunlar nerede?
  • Hangi kategoriler kalabalık, hangileri ise yeterince hizmet almıyor?

Ayrıca, aynı çekme işlemini her ay tekrarlayarak, sadece kimin ilk başladığını değil, kimin en hızlı şekilde yorum topladığını da takip edebilirsiniz.

Fiyatlar ve Teklifler

Fiyatlandırma araştırması basit bir soruyu yanıtlar: ne Rakipler ne kadar ücret alıyor ve bu ücretleri ne sıklıkla değiştiriyorlar? o? Fiyat ve teklif sayfalarını tek bir veri kümesinde topladığınızda, güncelliğini yitiren ekran görüntülerine güvenmek zorunda kalmadan fiyat aralıklarını, paketleri ve promosyonları karşılaştırabilirsiniz.

Şikago’da “ev temizliği” hizmetine yönelik bir fiyat değişikliği planlıyorsunuz. 20 ila 100 rakibin fiyatlandırma sayfalarını alın ve marka, paket adı, fiyat, fatura dönemi, promosyon metni, şehir veya bölge ve sayfa URL'si gibi sütunları dışa aktarın. Paket türüne göre (temel, derinlemesine, taşınma) gruplandırın, ardından fiyat aralıklarını ve indirim sıklığını karşılaştırın. Bu size gerçekçi bir fiyatlandırma sağlar. bant kendi ayarınızı yapmadan önce.

Bunu çekip dışa aktarabilirsiniz ile Outscraper'ı kullanın, ardından aynı veri kümesini yenileyin haftalık veya aylıky. Aynı veri alımını her ay tekrar yaparsanız, bu işlem basit bir fiyat takibine dönüşür.

Müşteri Duyguları

Müşteri algısı Birkaç hikâyeye ve ekran görüntüsüne güvenmekten vazgeçtiğinizde bunu ölçmek daha kolay hale gelir. Yorumlar, müşterilerin neleri övdüğünü, nelerden şikayet ettiğini ve bu fiyata ne beklediklerini gösterir. Yorum metinlerini ve puanları dışa aktardığınızda tek seferde veri kümesinde, geri bildirimleri gruplandırabilirsiniz temalara göre ve en sık neyin çıktığına bakın.

“Dallas’taki tesisatçılar” araması yapıyorsunuz.” Bölgedeki en iyi işletmelerin yorumlarını inceleyin ve etiket temalar gibi yanıt süresi, fiyat şeffaflığı ve iletişim. If the same complaints repeat across competitors, you get clear direction on what to fix and what to promise.

That can shape your messaging, your service standards, and what you prioritize next. When you refresh it monthly, you get ongoing review monitoring for key competitors.

Demand Signals & Trends

Listings and search results can show where interest is building before it shows up in a quarterly report. They are not perfect demand measures, but they are useful early signals. It’s basic trend analysis using listings and search visibility as early signals.

You can track:

  • How many new businesses appear in a category over time
  • Which neighborhoods are adding new entrants
  • Which brands consistently rank in search for high-intent keywords

If you refresh the same pulls monthly, you can spot categories that are heating up, areas getting more crowded, and competitors gaining visibility.

Market Mapping

Location data helps you spot gaps that averages hide. Map competitors by area, then compare how many options exist versus how strong they look.

Look for:

  • Areas with high visibility but few high-rated providers
  • Areas with many listings but weak ratings
  • Pockets missing a category or service

This makes it easier to pick where to expand, where to run ads, and what to lead with.

Next, we’ll bakın which sources to pull from and what each one is best for (Google Maps, Reviews, Search results, and any website).

Pull Your First Dataset
Pick a source, export a file, and build a baseline you can refresh monthly

Sources of Market Research Data

Good market research comes from combining signals. One source tells you what exists. Another tells you what customers think. Another shows who gets attention. Review themes and SERPs are also useful for product research and product discovery, especially when you’re validating features and messaging.

Outscraper lets you pull from these public sources and export the results into a file you can measure and compare.
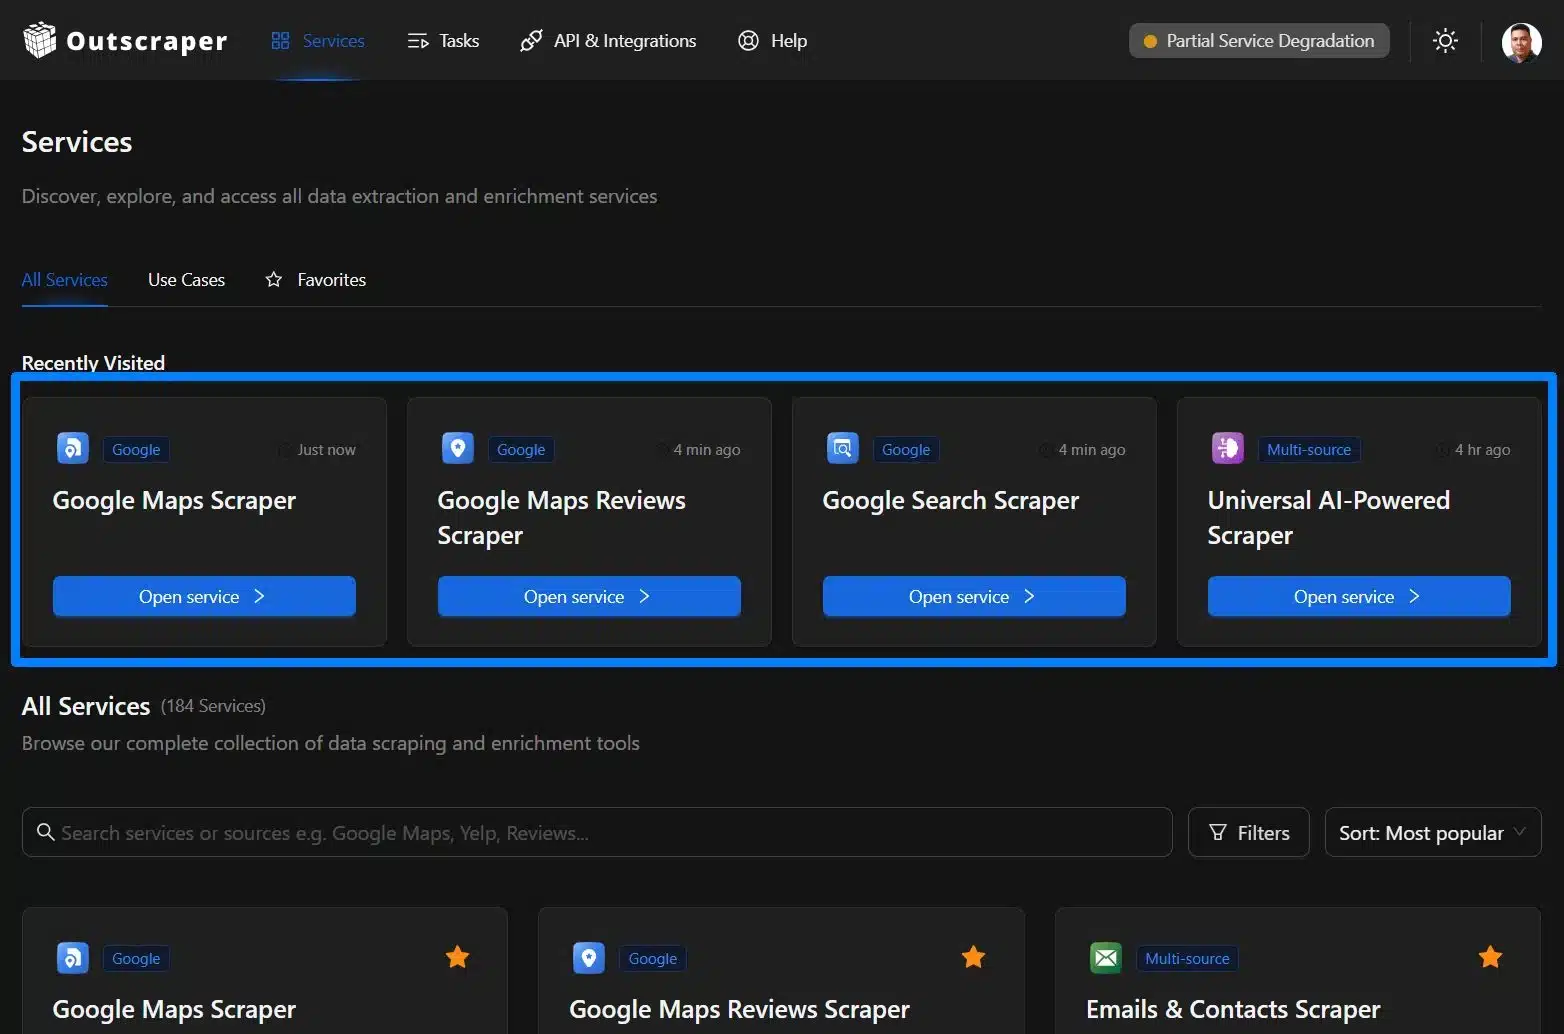
Outscraper Market Research Tools

Market Research Tools from Outscraper

Google Maps (Places, Categories, Attributes)

Google Maps is a strong starting point for local market research. It helps you see how crowded a category is in a city and how each business presents itself. 

Use it to pull fields like category, address, phone, website, hours, rating, review count, and attributes such as “wheelchair accessible” or “outdoor seating”. With that, you can spot gaps gibi areas with high demand but few high-rated options, or categories that are packed in one neighborhood and thin in another. Recommended Tool: Google Haritalar Veri Kazıyıcı

Reviews Platforms (Google, Trustpilot, and More)

Reviews are where you find the reasons behind ratings. They show what customers praise, what they complain about, and what they expect for the price.
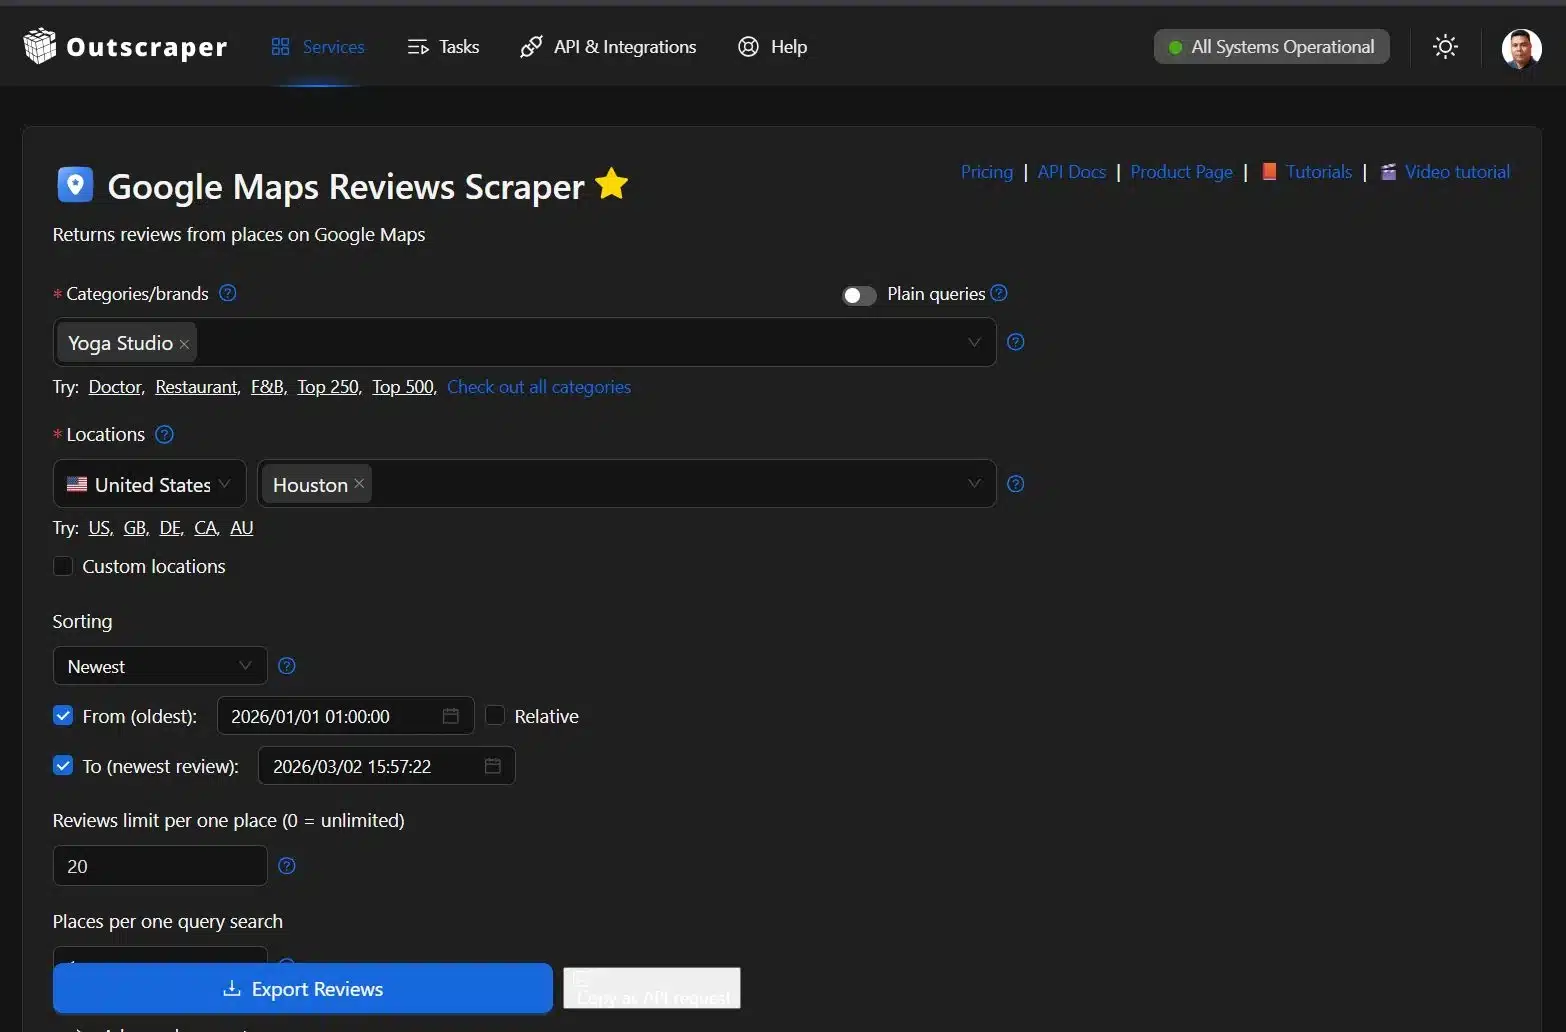
Google Yorumları Kazıyıcı

Google Maps Reviews scraper dashboard

Pull review text and ratings at scale, then group feedback into themes like response time, pricing transparency, reliability, and support. This is useful for messaging, positioning, and product decisions because it is based on repeated patterns, not a few loud opinions. Recommended Tool: Google Haritalar Yorumları Kazıyıcı

SERPs / Search Results

Search results show who owns high-intent queries. They also show what Google is rewarding for a topic in a market right now.

Pull SERPs for your keywords and locations to see which competitors rank, what pages they use, and what formats show up often (maps, ads, product pages, list posts). This helps you bul content gaps, spot aggressive advertisers, and choose keywords that match buyer intent. Recommended Tool: Google Arama Sonuçları Toplama ve Listeleme Aracı

Any Website via Universal AI Scraper

Some markets live on niche directories and marketplace sites. The Universal AI Scraper is for those use cases.

An AI scraper reads a page like a person and turns it into structured rows you can export. Use it when the site layout is inconsistent or the data is buried in listings that do not follow a clean pattern. Recommended Tool: Evrensel AI Kazıyıcı

How to Use Outscraper's No-Code Workflow for Market Research

You do not need to be a developer to run market research with web data. The goal is to go from blank page to a usable dataset fast. The steps below use Google Maps scraper as an example.

Other scrapers follow the same idea, but the inputs can change. For example, a Search scraper starts with keywords, and the Universal AI scraper starts with URLs.

Step 1: Define Your Market and ICP

Start with two decisions: where ve ne.

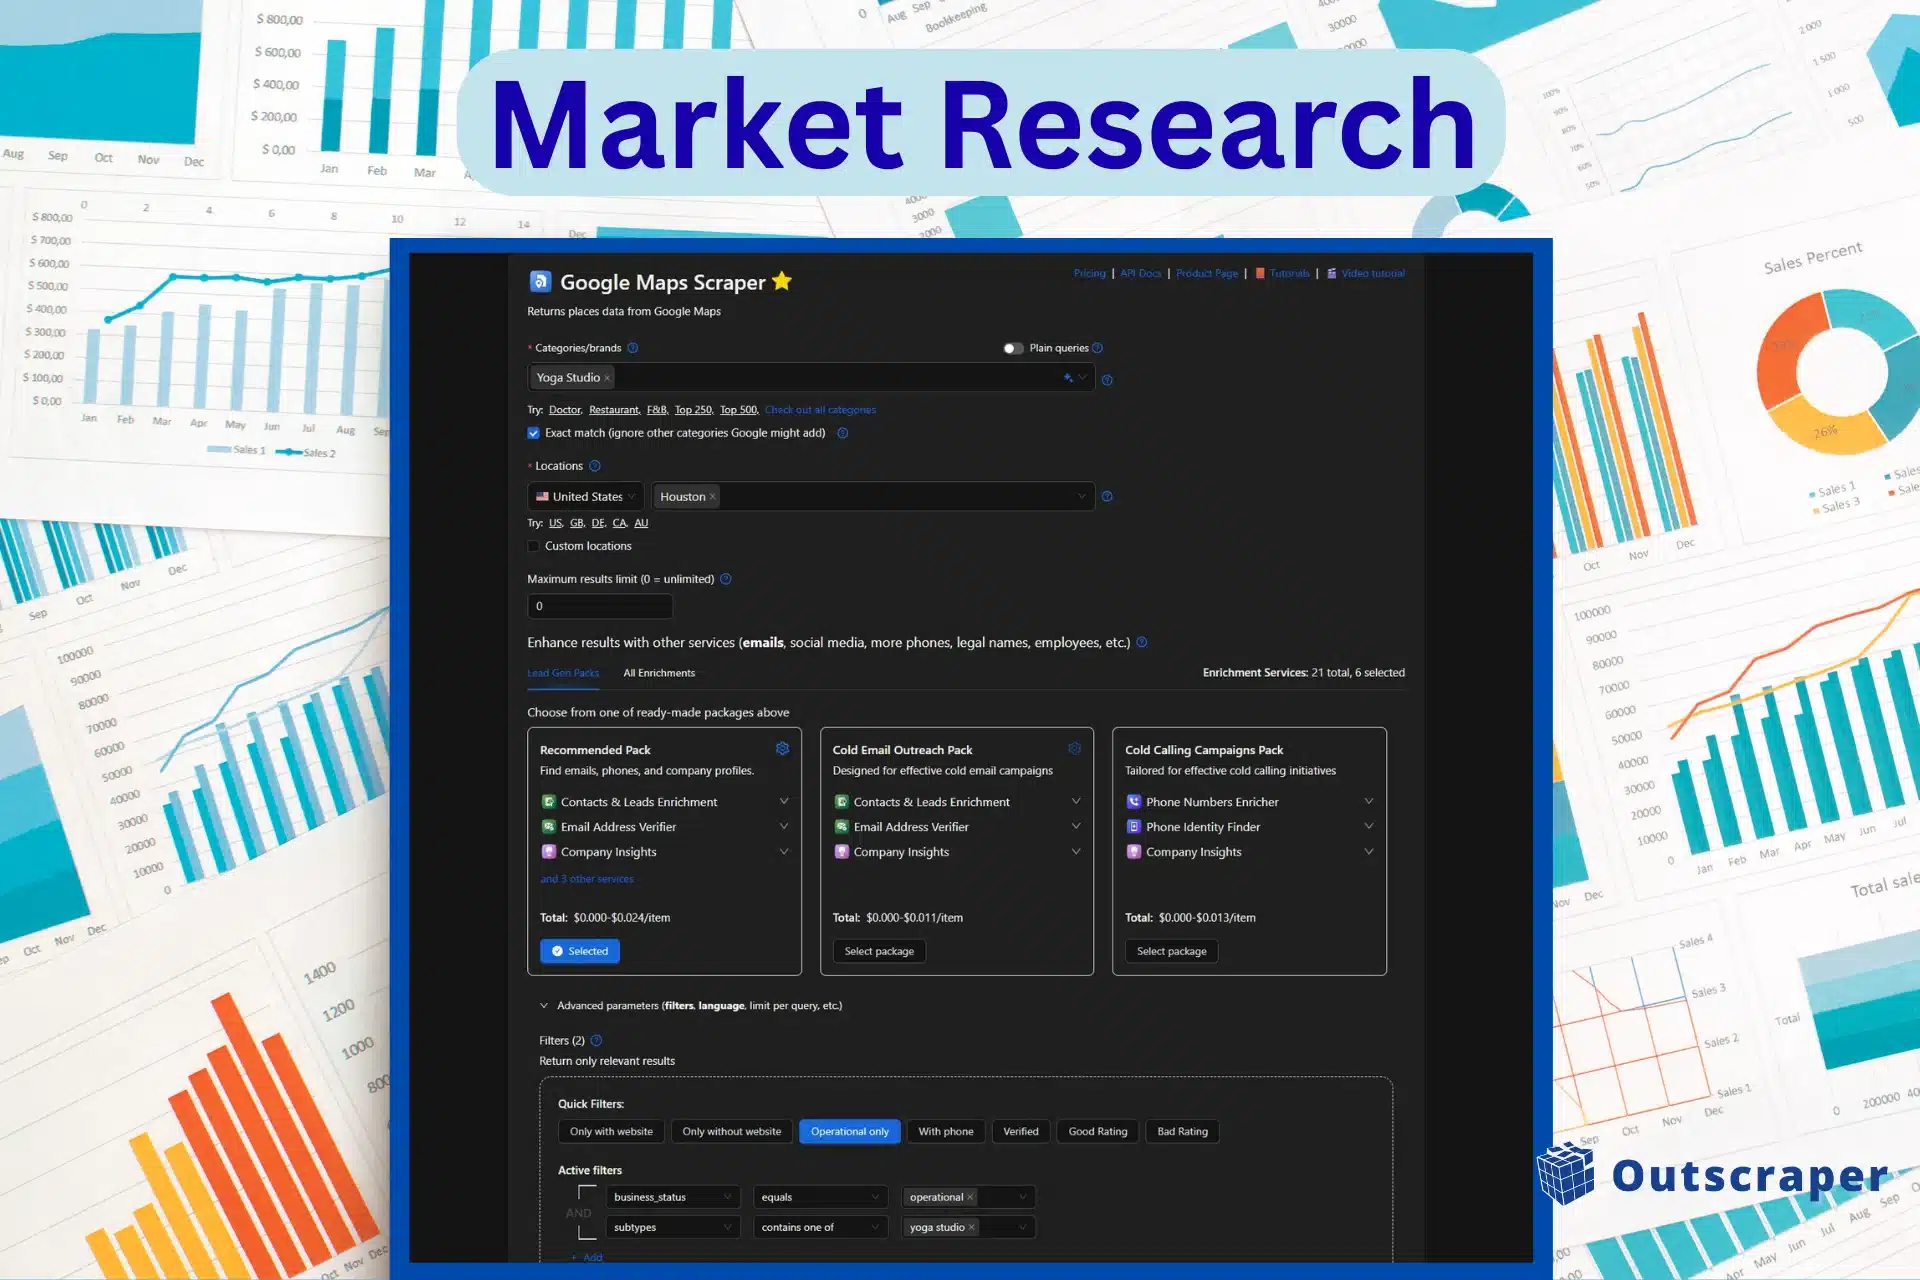
Pick a geography and a category, then narrow it down. Be specific. If you are researching the fitness market in Houston, don’t just search for “gyms.” Look for “CrossFit,” “Pilates,” or “Yoga studios” so the results reflect the competitors that matter.
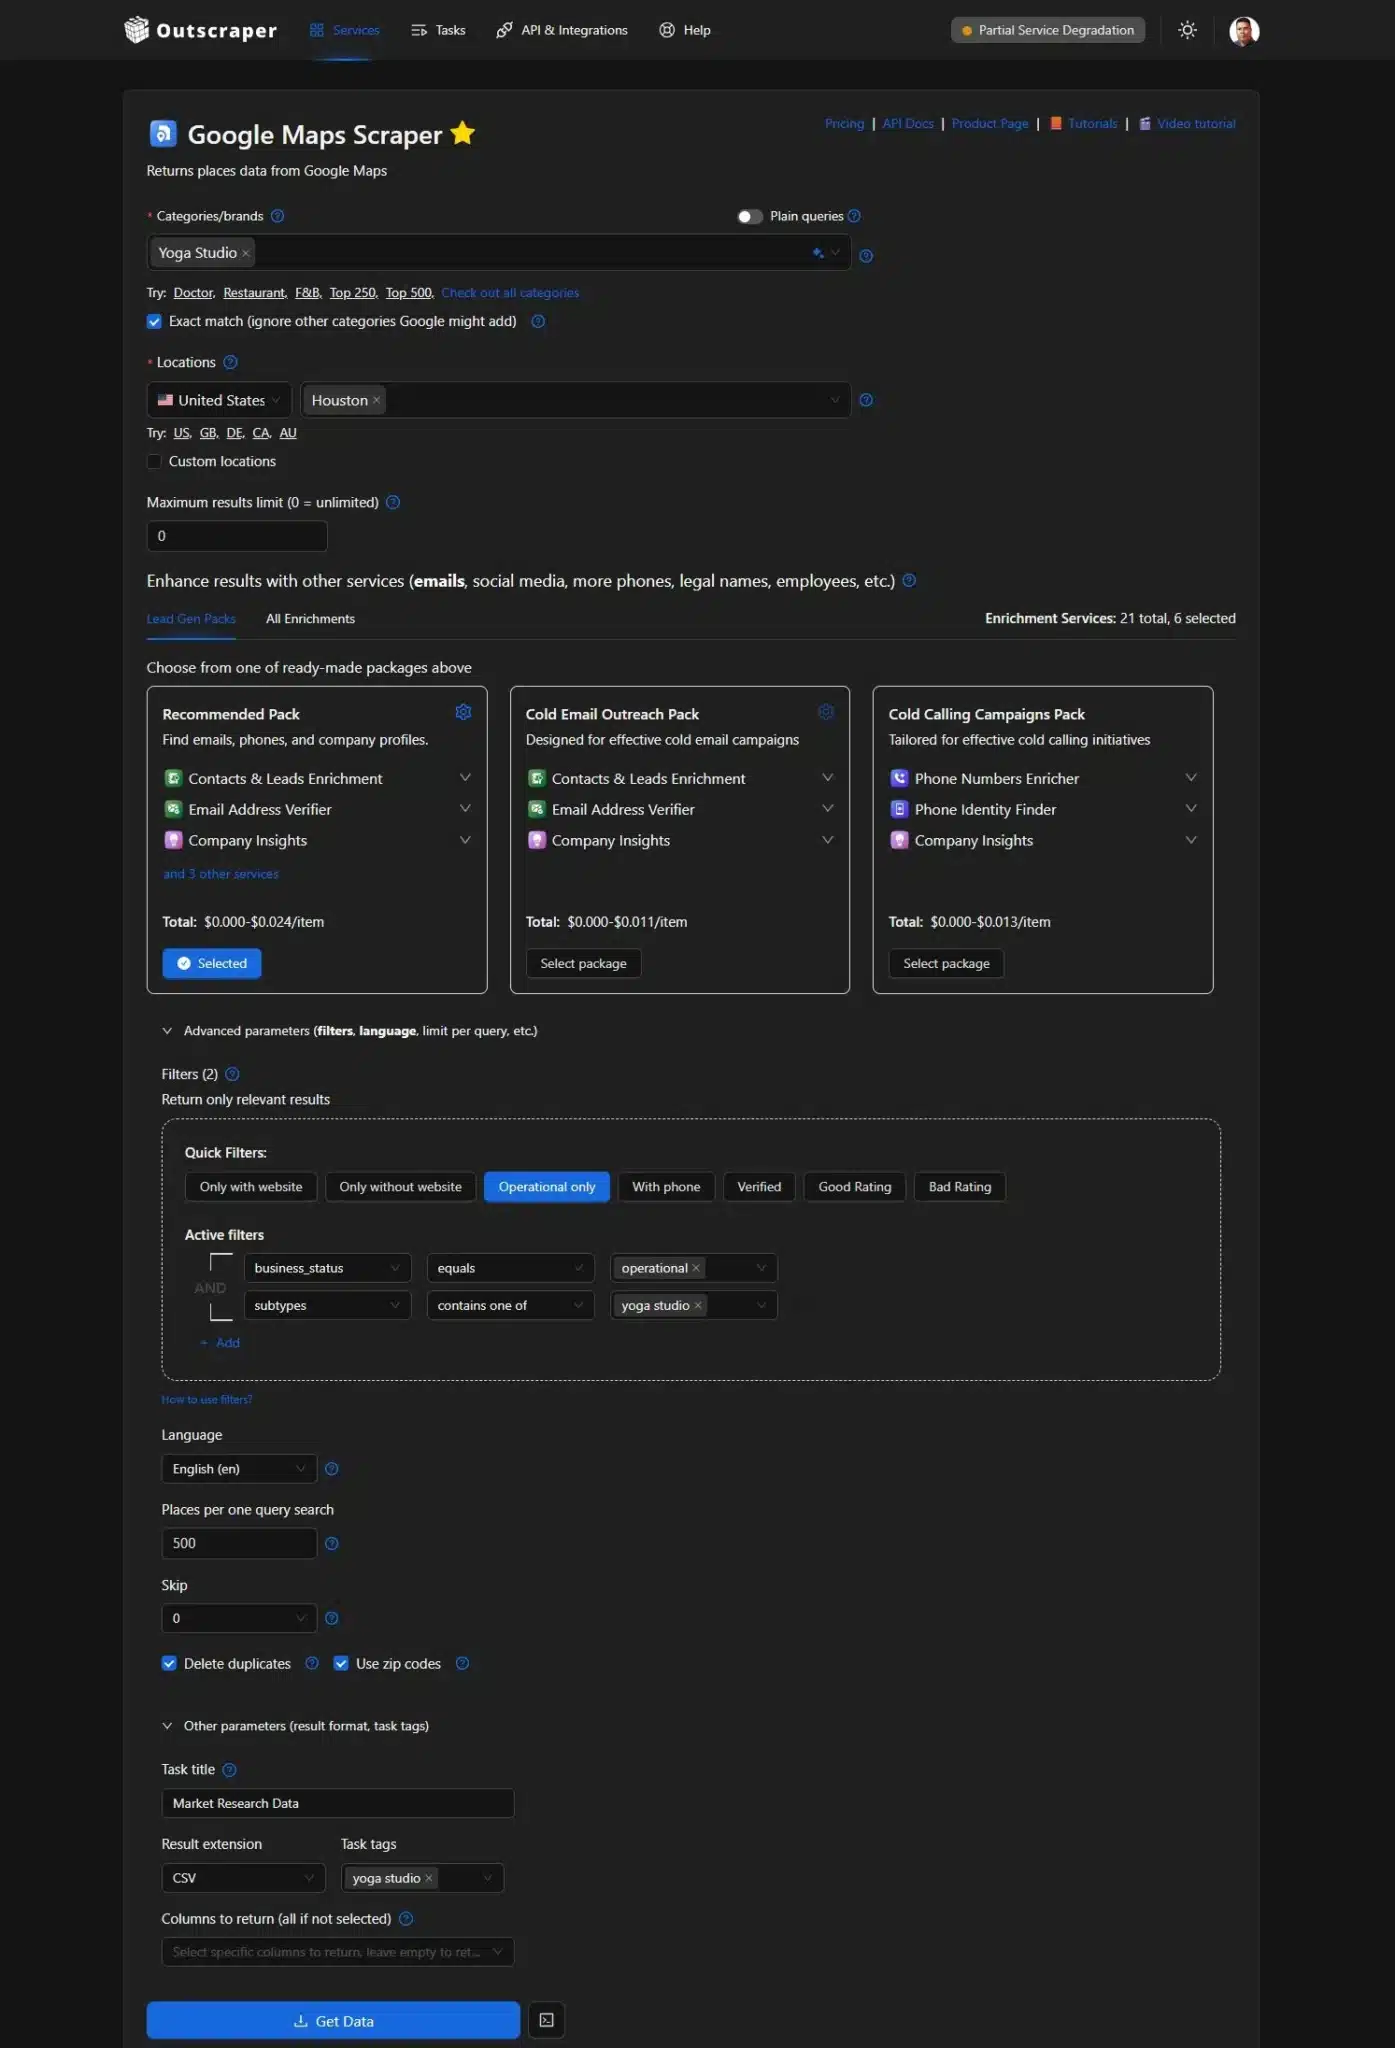
Google Maps for Market Research

Selecting Yoga Studio category using Google Maps Scraper for Market Research

Run small first. Pull a few hundred results, check the output, and then scale up. Check the “Exact Match” option to ignore other categories Google might add. If you’re not selecting categories, you can also toggle “Plain Queries,” but you need to input the search keywords, Place IDs, URL, etc.

Step 2: Collect Structured Data

Run the task and export the results. Structured data is information arranged içinde clean columns, gibi a spreadsheet.

Instead of copying from a web page, you al a file with consistent fields gibi business name, category, address, phone, website, rating, and review count. That makes it easy to sort, filter, and compare.

Before running, you can set output/organization options such as Result extension (CSV), task title, task tags, and columns to return. Then you run it via the main action, the Verileri Al Düğme.

Step 3: Enrich for Research-Ready Datasets

A list of businesses is a starting point. If your research needs contact or profile details, you can enrich the dataset. The enrichment is optional, but if you need to enhance results with other services like the Lead Gen Packs, which will give you Contacts & Leads enrichment, an email address verifier, and company insights.
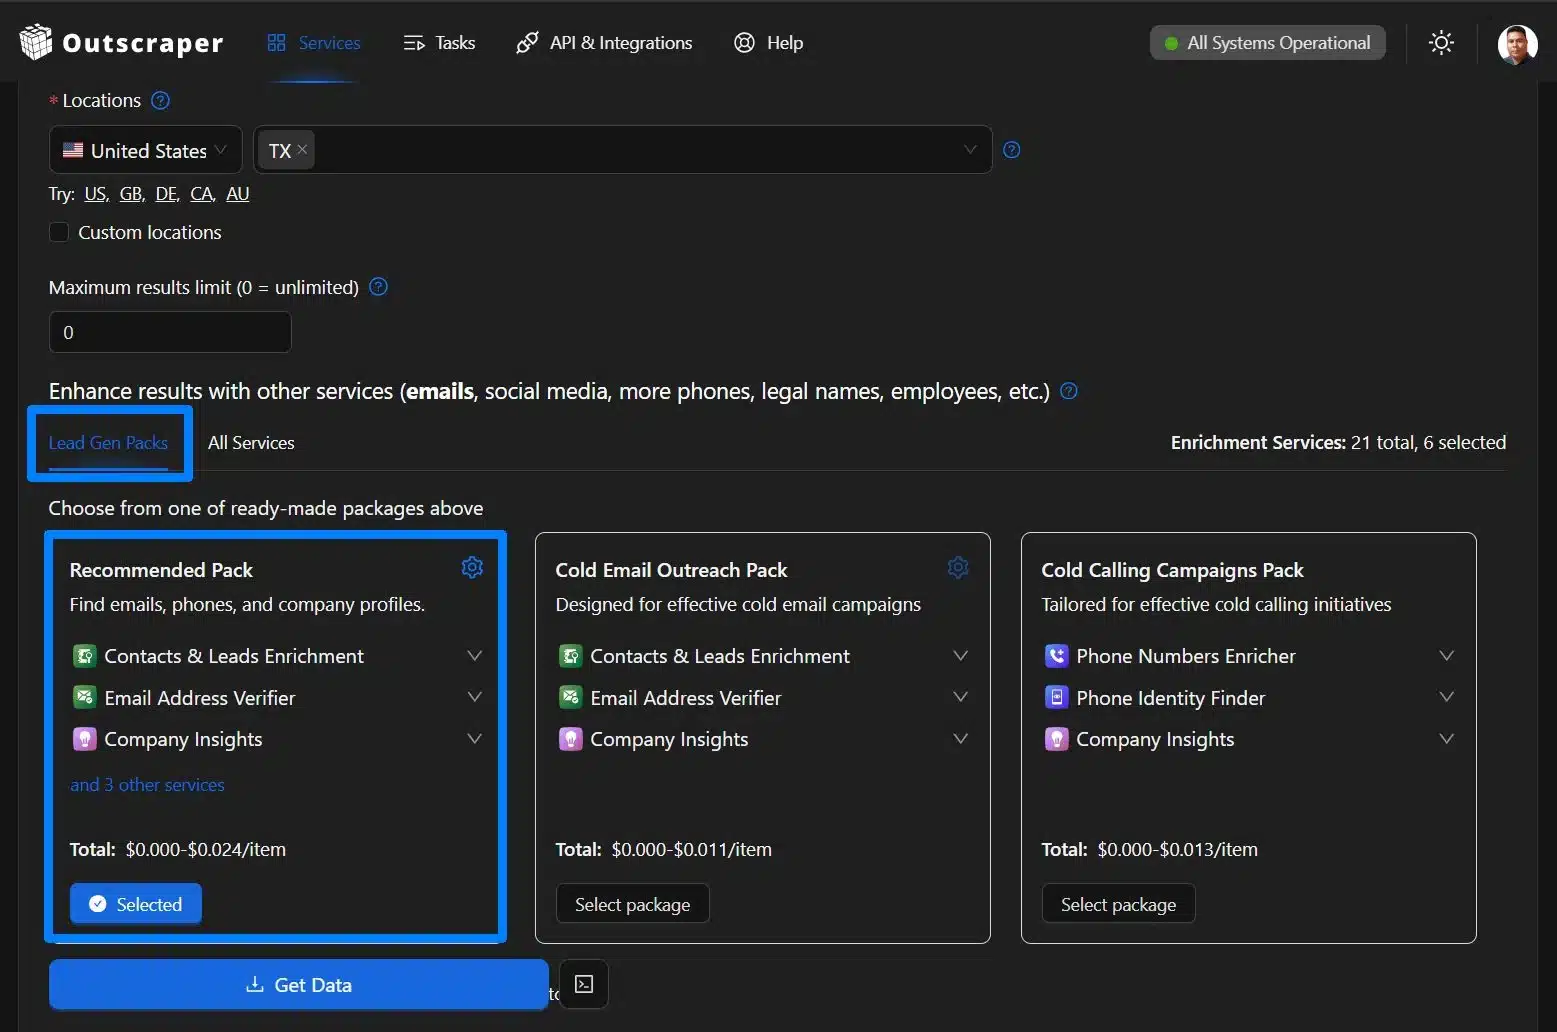
Outscraper's Lead Gen Pack

Outscraper’s Lead Gen Pack Enrichment

Common data enrichments include adding emails, social links, and extra metadata, plus removing duplicates. If you use verifiers, they help confirm that contact fields are still active, so you are not working with dead rows.

Optional: Filters and Advanced Settings

Use advanced options when you need to narrow the dataset before exporting.

Common filters include:

  • Quick filters (Only with website, Only without website, Operational only, With Phone, Verified, Good Rating, Bad rating).
  • Dil
  • Tek sorgu araması başına yerler
  • Skip (pagination)
  • Delete duplicates
  • Posta kodlarını kullanın

Make sure to check the yinelenenleri sil and use the ZIP codes option if you want to al all the data within a specific city. For easier reference of your task, you can add a task title, results extension, and task tags. If you only need specific fields, return only the columns you plan to analyze.

Step 4: Analyze & Visualize Your Data

Move the export into the tool you already use, such as Google Sheets, Excel, or a Business Intelligence tool.

From there, you can build simple views like:

  • Competitor density by neighborhood
  • Rating distribution by category
  • Top competitors by review volume
  • Gaps where many listings exist, but ratings are weak
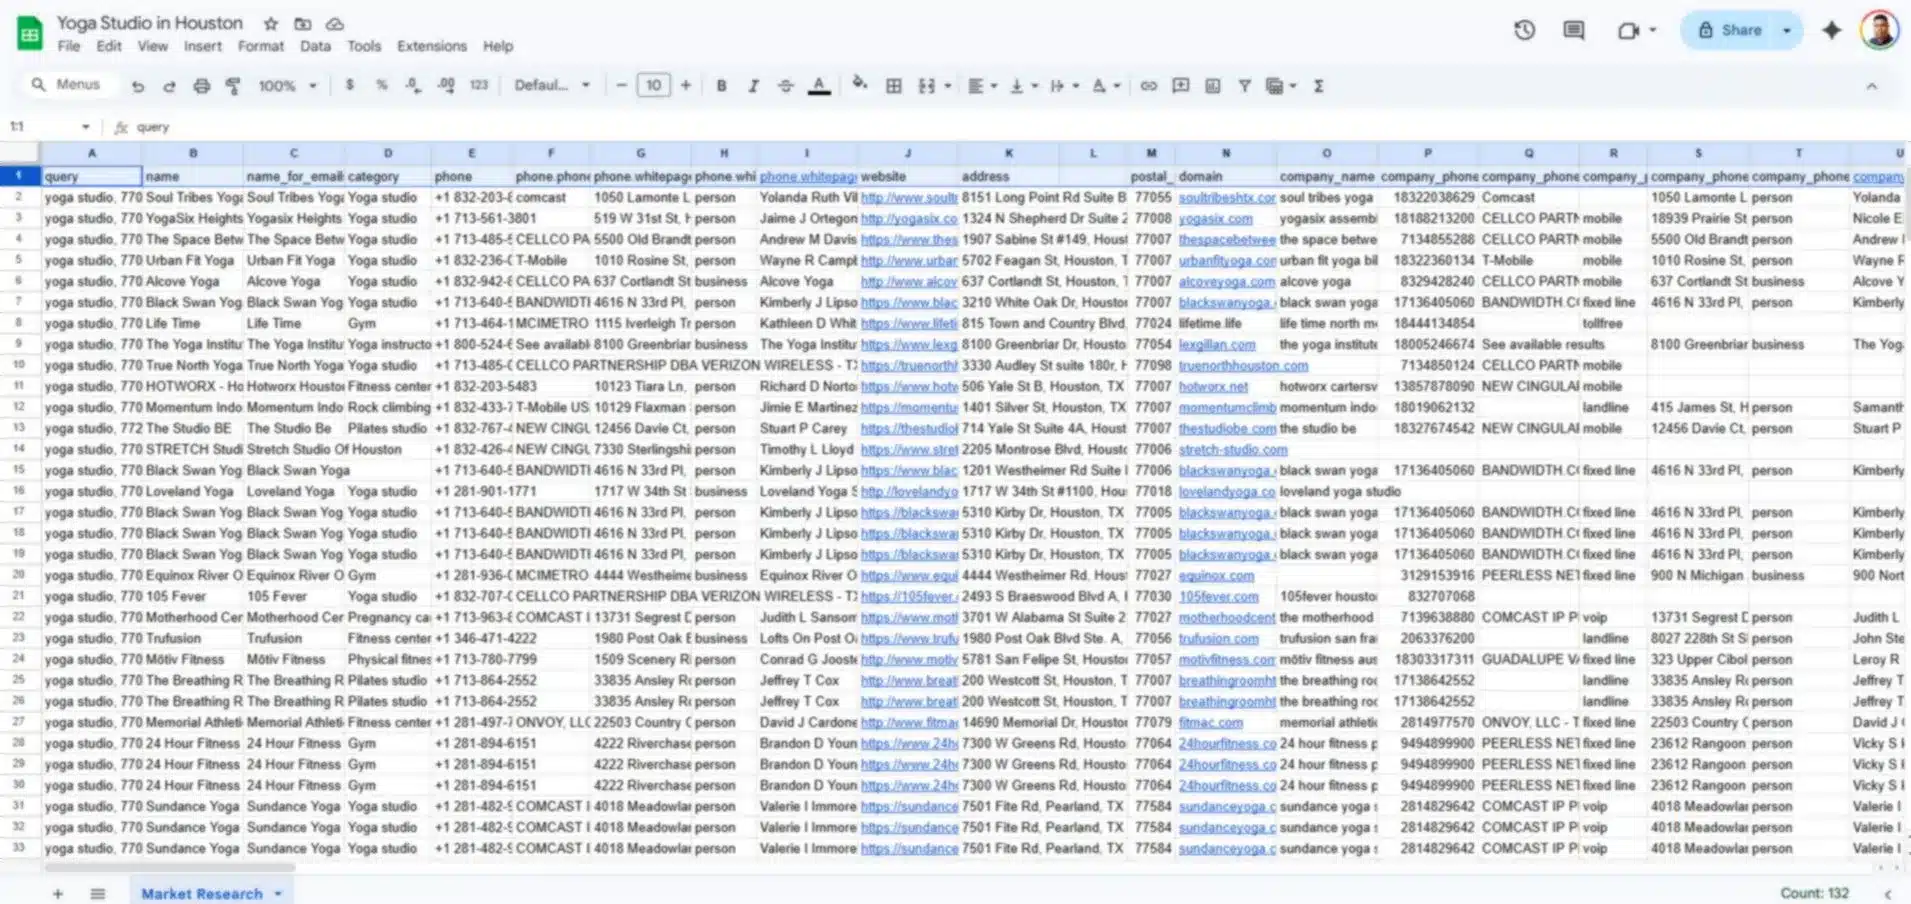
Sample data for Market Research

Yoga Studio data in Houston for Market Research

Step 5: Monitor Changes in the Market

Markets change every day. New competitor appears, ratings shift, and pricing pages update.

You can set up recurring pulls to refresh your dataset on a schedule. Instead of rebuilding the sheet each month, you can update the same analysis with new rows. This turns a one-off market research into an ongoing monitoring system.

Start With a Small Pull
Export the file, check the columns, then scale up once it fits your workflow.

Use Case Playbooks

Market research data is only useful if it changes a decision. These playbooks show what to pull, what to measure, and what to do next. Each one can start with a small export and scale up once the output looks right.

Market Sizing with Google Maps Categories

Goal: Estimate Total Addressable Market (TAM).

Pull all businesses in a category across your target locations, then count how many active listings exist by city, ZIP code, or neighborhood. Export a file ile business name, category, address, rating, review count, and status yani sen yapabilir segment and remove non-useful data. Use this as a quick TAM analysis proxy by category and geography. 

Karar: Whether a region looks saturated, where coverage is thin, and where to test first before spending on ads or sales.

Competitor Benchmarking (Ratings, Review Volume, Attributes)

Goal: See what “good” looks like and who sets the baseline for trust.

Export competitor listings and compare ratings ranges, review counts, recency of reviews, and key attributes (services, amenities, verified status). This helps you separate “lots of listings” from “strong operators customers trust.”

Karar: Your positioning angle, what you need to improve, and which competitors to monitor.

Pricing Intelligence

Goal:  Ste pricing using current market behavior and track promos across multiple sites.

Pull pricing or offer pages from a defined competitor list, then export price, package name, billing period, promo text, and page URL with a date stamp. Refresh the same pull monthly so you can see who discounts often and ne price ranges are stable.

Karar: Your pricing band, promo timing, and which packages to lead with.

Voice of Customer (VoC)

Goal: Turn review patterns into messaging and improvements.

Export review text, rating, date, business name, and location. Tag themes like response time, pricing clarity, reliability, and support, then compare what shows up in low ratings versus high ratings.

Karar: What to promise in marketing, what to fix operationally, and what to prioritize next.

Launch Planning

Goal: Choose a launch area and message that fits local conditions.

Combine competitor density and quality by area (listings, ratings, review volume) with search results for your core keywords. You are looking for places where demand signals are present but existing options are weak or inconsistent.

Karar: Where to start, what to offer to test first, and what message to lead with.

Lead List for Research Interviews

Goal: Recruit the right people for interviews to validate assumptions.

Build a list of active businesses in your target category and location, then prioritize ones with recent reviews. and complete profiles. Export contact fields where available, plus activity signals, so outreach is targeted and you are not guessing who is still operating.

Karar: Who to interview, what questions to ask based on the data patterns, and what assumptions to confirm before committing budget.

Run Your First Playbook
Choose one playbook, pull the data, export it, and make a decision from the baseline.

Why Use Outscraper Over Alternatives (And Getting Started Fast)

For market research, the tool matters less than the workflow. You want to pull public data, export it, and refresh when the market changes, without turning it into a project or a maintenance job.

If you’re comparing tools like Apify, BrightData, Octoparse, or Oxylabs, the main difference is where you want to spend time. Some platforms are great when you need custom scraping logic, heavy proxy infrastructure, or developer-first workflows. Outscraper Business Data and Enrichment platform is built for teams that want a fast path from question into export and then analysis.

Why Teams Choose Outscraper

  • Fast path to usable export: Run a task, export the results, and start analyzing. You can export to CSV, XLSX veya JSON (a simple text format for data).
  • Less scraping maintenance: Outscraper handles common blockers in the background. A proxy routes requests through different IP addresses to avoid blocks, CAPTCHA (“prove you’re human” checks web sitesi use to slow automated tools).
  • Clear, usage-based pricing: You can start small, validate the output, then scale. You pay based on usage yerine buying a platform you are not sure you need yet.

Pricing That Scales With You

We believe you should see the value before you open your wallet. That is why our onboarding is built around speed and transparency.

  • Start on Free Tier and Test First: You can test your ideas with our free monthly allowance. There is no credit card required to get started. This allows you to run a few small tasks, kontrol et the data quality, and see if the output fits your research needs.
  • Pay for Results, Not Setup: Market research is rarely one-and-done. Pricing feels predictable when you can rerun the same pull haftalık or monthly ve control the scope.

Getting Started Fast

  1. Pick the sources that match your question: Maps for competitors list, Reviews for themes, Search results for visibility, Universal AI for niche directories ve marketplaces.
  2. Run a small pull first and confirm the columns you need.
  3. Export to CSV or XLSX, build your baseline, and rerun on a weekly or monthly schedule.
Build Your Baseline and Keep it Current
Start with one small pull. Export it. Refresh it weekly or monthly as the market changes.

SSS

SIKÇA SORULAN SORULAR

Bölgelere göre rakip analizi, fiyat aralıkları ve promosyonlar, müşteri kaybına yol açan yorum konuları, satın alma niyeti yüksek anahtar kelimelerde görünürlük ve seçeneklerin zayıf olduğu ya da bulunmadığı pazar boşlukları.

Rakip listeleri (Haritalar), fiyat karşılaştırmaları (web sayfaları veya rehberler), yorum teması analizi (Yorumlar) ve arama sonuçlarındaki görünürlük araştırması (Arama sonuçları). Çoğu ekip tek bir veri setiyle başlar, ardından değişiklikleri takip etmek için bunu aylık olarak tekrar çalıştırır.

Google Haritalar kategorilerini toplam adreslenebilir pazar (TAM) göstergesi olarak kullanın. Hedef bölgenizdeki bir kategorideki tüm işletmeleri listeleyin, yinelenenleri ayıklayın ve yoğunluk ile doygunluk düzeyini görmek için sayıları şehirlere veya posta kodlarına göre gruplandırın.

Hayır. Taramaları tarayıcıda çalıştırabilir ve sonuçları dışa aktarabilirsiniz. Bir Outscraper Google Haritalar Yorumları API Otomatikleştirmek isterseniz bu seçenek mevcuttur, ancak isteğe bağlıdır.

Dışa aktarımınız, çekme işlemini gerçekleştirdiğiniz anda kamuya açık olan bilgileri yansıtır. Sürekli bir görünürlük elde etmek istiyorsanız, aynı çekme işlemini haftalık veya aylık olarak tekrarlayarak temel verilerinizi güncelleyin.

Belirli kategoriler ve konumlarla başlayın, önce küçük bir örneklem üzerinde çalıştırın ve mümkünse “çiftleri sil” seçeneğini kullanın. Her çalıştırmada aynı girdileri kullanmak, aylık karşılaştırmaları da daha net hale getirir.


Ed Umbao

Outscraper’de İçerik Sorumlusu ve SEO Stratejisti olarak görev yapan Ed Umbao, web veri toplama gibi karmaşık teknik konuları kullanıcılar için anlaşılır, kolay bulunabilir ve gerçekten yararlı hale getirme konusunda uzmanlaşmıştır. Şu kanallardan bağlantı kuralım: Portföy | LinkedIn | GitHub