Mục lục
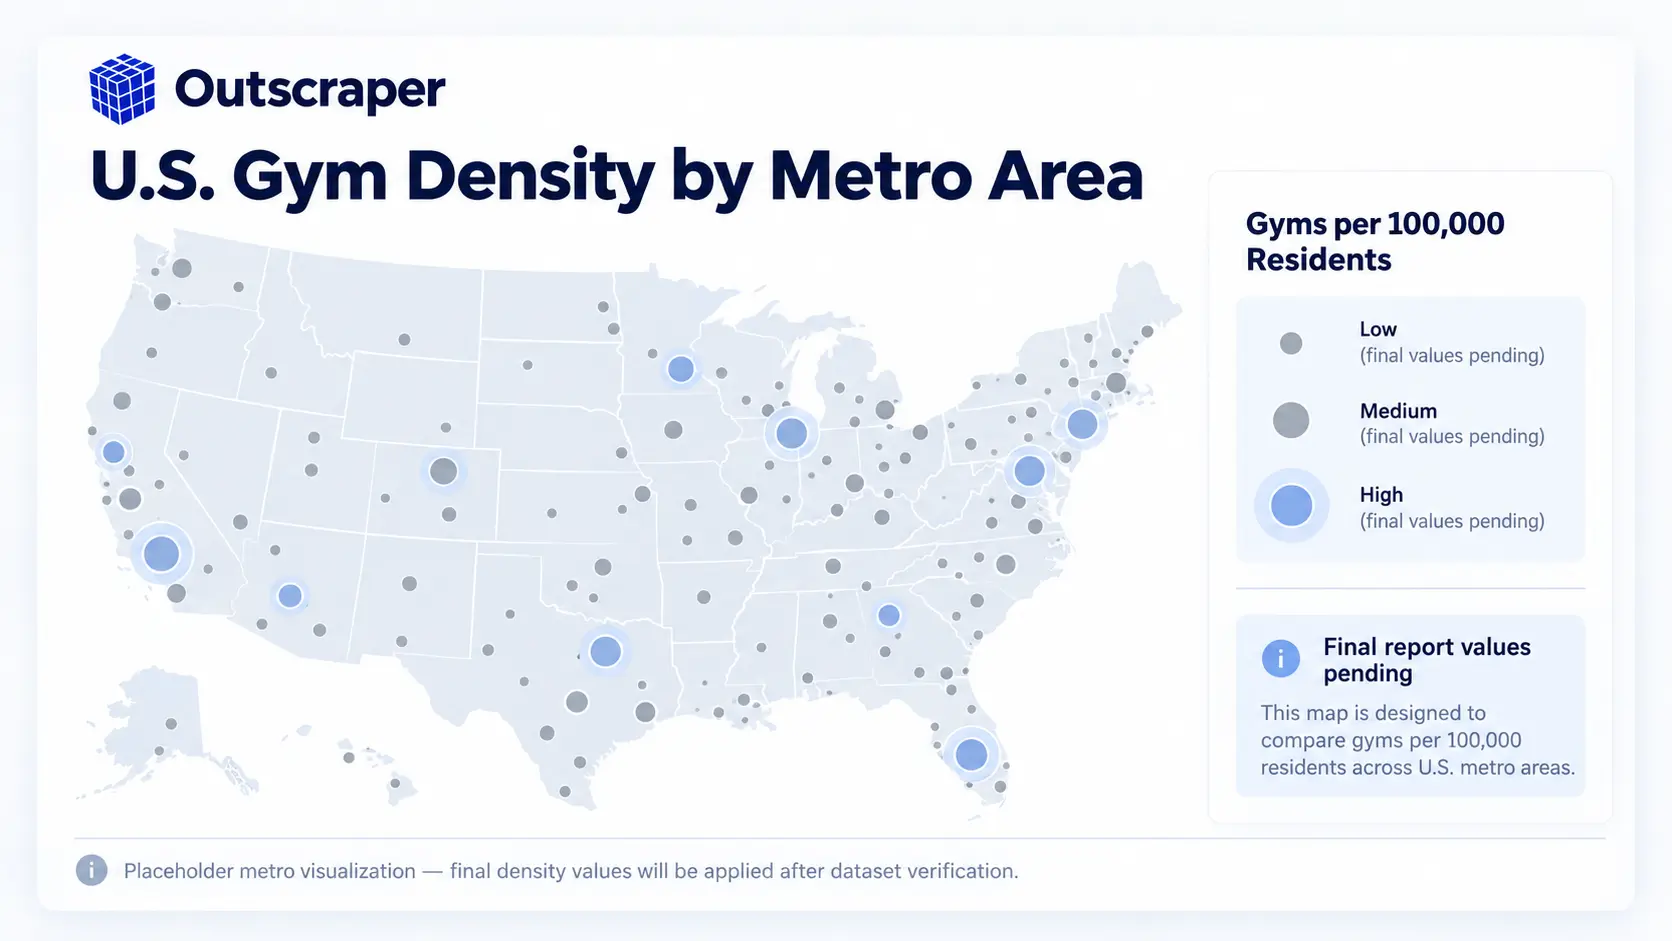
Gyms per capita can reveal where fitness supply is unusually concentrated, but the number only becomes useful when every market is measured with the same geographic and category rules. This 2026 U.S. gym market density report is designed to compare major metro areas using operating gym and fitness-center locations relative to population, then add context such as chain share, independent share, ratings, reviews, and format mix. The goal is not to declare a metro “saturated” from one ratio. It is to show where listed gym supply is concentrated, how that supply is structured, and what additional demand data is needed before making a market decision.
A density analysis starts with consistent business records. Collect operating gym locations, categories, coordinates, ratings, reviews, and other fields before comparing markets.
Quick answer
A useful gym-density report compares the same business definition across the same type of geography, then divides qualifying operating locations by population. For this project, the preferred unit is U.S. metro areas, not city limits. Gym density should be treated as a supply indicator, while chain concentration, review activity, format mix, population growth, income, and local trade areas provide the context needed to interpret whether competition is actually intense.
Why Gym Density Is Worth Measuring in 2026
The U.S. fitness market is large enough and location-dependent enough for geographic supply differences to matter.
The Health & Fitness Association reported that a record 81 million Americans belonged to a gym, studio, or other fitness facility in 2025, representing 26.1% of the population age six and older. When non-members using day passes and similar access are included, more than 100 million Americans used a fitness facility during the year.
Physical expansion is continuing as well. CBRE reported that boutique fitness concepts had more than 700 planned U.S. openings in 2026, totaling more than 1.5 million square feet. Pilates, interval training, and yoga concepts were among the most active expansion categories.
Those trends make competitor location data relevant, but national growth does not mean every metro presents the same conditions. One market can have a dense network of established chains while another has fewer gyms but a much more fragmented independent base.
That is why this report focuses first on supply density.
A metro with 35 qualifying gym locations per 100,000 residents has a different visible supply structure from one with 18. But that difference should start the analysis, not finish it.
What Counts as a Gym in This Report?
Category definition can change a density ranking substantially.
Google’s current place taxonomy distinguishes types including gym và fitness_center, while categories such as yoga_studio và sports_club exist separately. A place can also have more than one associated type.
For the primary density ranking, the cleanest approach is to include businesses that qualify under the report’s defined gym / fitness-center universe and analyze more specialized formats separately.
That prevents a metro with many yoga or Pilates studios from appearing to have the same type of gym supply as a market dominated by general-purpose fitness centers.
The main ranking should therefore use a documented inclusion rule and preserve each business’s category and subtype fields for later segmentation.
A useful dataset should retain:
| Lĩnh vực | Why it matters |
|---|---|
| Tên doanh nghiệp | Identifies the listing |
| Place/Google ID | Supports deduplication |
| Primary category | Determines report eligibility |
| Các loại phụ | Helps analyze fitness format |
| Business status | Excludes non-operational records |
| Địa chỉ | Supports geographic QA |
| Latitude/longitude | Assigns the record to the correct metro |
| Đánh giá | Public reputation context |
| Số lượt đánh giá | Public review-activity context |
| Trang mạng | Supports business/brand validation |
| Chain status | Separates chain and independent supply |
This also prevents a common market-research problem: collecting every available field without first defining which fields support the decision being studied. Outscraper’s existing market-analysis guide recommends defining the market question, business types, and geographic scope before selecting fields.
How the 50-Metro Gym Density Ranking Should Be Calculated
A credible ranking depends more on consistent methodology than on producing the largest possible spreadsheet.
1. Use metro areas instead of city limits
The report should compare metropolitan statistical areas, not legal city boundaries.
Fitness facilities serve trade areas that cross municipal borders. A resident living just outside a central city can still use a gym inside it, while suburban facilities can serve customers from the city.
The U.S. Census Bureau’s Vintage 2025 estimates provide the most recent completed and consistent set of metro-area population estimates currently available.
For this report, the proposed universe is:
the 50 largest U.S. metropolitan statistical areas by 2025 population.
2. Use one consistent density formula
For every qualifying metro:
Gym density = qualifying operating gym locations ÷ 2025 metro population × 100,000
Using a common denominator makes metros of very different sizes comparable.
A metro with 500 gyms is not necessarily more gym-dense than one with 200. Population determines the relative supply.
3. Clean the data before calculating the ranking
Large markets may require multiple geographic queries rather than one broad search. Results should then be combined, checked for operational status, assigned to the correct metro geography, and deduplicated at the location level.
Separate branches of the same chain should không automatically be deleted as duplicates. They are legitimate supply locations.
The analysis should also record the collection date so future versions can be compared against the same methodology.
A reproducible final dataset should contain at minimum:
| Metric | Calculation / source |
|---|---|
| Metro population | Census Vintage 2025 |
| Qualifying gym locations | Dated Google Maps collection |
| Gyms per 100,000 residents | Locations ÷ population × 100,000 |
| Chain share | Chain locations ÷ qualifying locations |
| Independent share | Non-chain locations ÷ qualifying locations |
| Median rating | Median rating across qualifying locations |
| Median review count | Median review count across qualifying locations |
| Fitness format mix | Share by defined category/subtype |

For a report like this, the value comes from using the same categories, geography rules, fields, and cleanup method in every market—not from manually searching each city differently.

Which Metro Areas Have the Most Gyms per Capita?
The 2026 benchmark shows a wide difference in visible gym supply across major U.S. cities. The dataset measured places returned for a “gym” search inside the legal boundaries of 40 large cities, removed duplicate places, and compared the results with city population. Data was collected on July 22, 2026.
| Rank | City | Measured gyms | Population | Gyms per 10,000 residents | Gyms per 100,000 residents |
|---|---|---|---|---|---|
| 1 | Pittsburgh, PA | 177 | 304,759 | 5.82 | 58.2 |
| 2 | Atlanta, GA | 290 | 505,268 | 5.73 | 57.3 |
| 3 | Raleigh, NC | 249 | 481,031 | 5.17 | 51.7 |
| 4 | Miami, FL | 234 | 459,745 | 5.09 | 50.9 |
| 5 | Denver, CO | 338 | 718,877 | 4.70 | 47.0 |
| 6 | San Diego, CA | 622 | 1,389,526 | 4.48 | 44.8 |
| 7 | Oklahoma City, OK | 305 | 697,125 | 4.38 | 43.8 |
| 8 | El Paso, TX | 272 | 680,130 | 4.00 | 40.0 |
| 9 | Minneapolis, MN | 169 | 427,246 | 3.96 | 39.6 |
| 10 | Portland, OR | 247 | 641,165 | 3.85 | 38.5 |
Pittsburgh ranks first in this city-level benchmark at 5.82 gyms per 10,000 residents, followed closely by Atlanta at 5.73. Raleigh and Miami also exceed five gym listings per 10,000 residents, while Denver completes the top five. Across all 40 cities in the dataset, the measured range runs from Pittsburgh’s 5.82 to Phoenix’s 1.42 gyms per 10,000 residents.
The ranking should not be read as a direct list of the most commercially saturated markets. City boundaries differ substantially: compact cities can concentrate business locations over a smaller resident population, while geographically larger cities can appear less dense. The source also notes that the “gym” search includes a broader mix of fitness businesses such as CrossFit boxes, martial-arts gyms, and studio concepts.
For market research, the table is best treated as a supply-density benchmark. It shows where visible fitness businesses are concentrated relative to population, but the next step is to examine local trade areas, gym format, demographics, and demand before drawing conclusions about actual saturation.
Important methodology note
This benchmark is based on cities, not metropolitan areas. The source searched across each city’s administrative boundary, deduplicated results by place ID, and used ACS city population as the denominator.
Why High Gym Density Does Not Automatically Mean Market Saturation
A high number of gyms per capita indicates visible supply concentration.
It does not establish that a market has too many gyms.
That distinction matters because demand varies substantially by market and fitness format.
A metro can support more facilities when it has strong population growth, high fitness participation, favorable demographics, or strong spending power. A market can also look dense in aggregate while still having room for a specific concept that competes with only a small subset of existing facilities.
The industry’s current expansion makes that distinction even more important. Boutique fitness alone had more than 700 planned U.S. openings in 2026, but those openings span different formats including Pilates, interval training, and yoga.
Chain share changes the interpretation
Two metros can each have 30 gyms per 100,000 residents while having very different competitive structures.
Imagine:
| Metro | Gym density | Chain share | Independent share |
|---|---|---|---|
| Metro A | 30 per 100k | 70% | 30% |
| Metro B | 30 per 100k | 25% | 75% |
The supply density is identical.
The market structure is not.
Metro A may be dominated by established networks with standardized offerings and broad geographic coverage. Metro B may be more fragmented, with a larger number of independent operators and specialized concepts.
That is why chain concentration belongs beside density rather than being treated as a separate curiosity.
Ratings and reviews add public-market context
Median ratings and review counts do not measure revenue or membership.
They can, however, provide context about public reputation and visible engagement.
A dense market where incumbents also have very high review volumes can look different from a dense market where many locations have relatively little public review activity.
Outscraper’s existing local-market-sizing methodology similarly treats Google Maps business data as evidence about visible competitors and public signals not as a substitute for revenue, actual membership, or complete demand information.
Add context before calling a market saturated
Density should be one layer of the analysis. Compare categories, operational status, locations, reviews, and other fields before interpreting competitive intensity.

How Outscraper Can Build and Refresh the Dataset
Outscraper can provide the structured Bản đồ Google data needed to compare gym markets consistently, including business names, categories, operating status, locations, ratings, reviews, websites, and identifiers.
The key is to use the same collection rules for every metro area, remove duplicate location records, and combine the cleaned data with population figures to calculate gym density. Repeating the same method later also makes year-over-year comparisons possible.
The data shows visible gym supply, not total demand. For site-selection decisions, it should be considered alongside demographics, income, real estate, travel patterns, and the specific fitness format being evaluated.
Các câu hỏi thường gặp
Các câu hỏi và câu trả lời thường gặp nhất
Gyms per capita measures the number of qualifying gym locations relative to the population of a defined geography. In this report, the preferred expression is gym locations per 100,000 metro residents. It measures visible supply density, not demand or profitability.
No. High density shows that supply is relatively concentrated. Saturation depends on additional factors such as fitness participation, population growth, income, gym format, pricing, trade area, real estate, and the strength of existing competitors.
Metro areas better reflect economic and commuting regions that cross municipal boundaries. Fitness customers do not necessarily limit their choices to businesses inside one legal city boundary, so city-only comparisons can distort the population-to-supply relationship.
Not automatically. Google distinguishes categories such as gym, fitness_center, và yoga_studio. The report should define the primary gym universe consistently, then analyze specialist formats separately when the data supports it.
Whether the category is gyms, dentists, coffee shops, or another local industry, the same framework can be adapted by changing the business definition, geography, and analysis fields.